Tag: technical analysis

  • Dogecoin Price Alert: Critical Triangle Pattern Signals $0.19 Test

    Dogecoin Price Alert: Critical Triangle Pattern Signals $0.19 Test

    Dogecoin (DOGE) has entered a critical technical phase as price action consolidates within a bearish descending triangle pattern, suggesting an imminent major move. The popular meme cryptocurrency is showing signs of increased selling pressure while testing key support levels that could determine its short-term trajectory.

    As recent analysis predicted a critical June breakout for DOGE, the current price compression adds weight to that forecast. Technical indicators now point to a potential bearish resolution unless buyers can mount a strong defense.

    Technical Analysis Shows Mounting Bearish Pressure

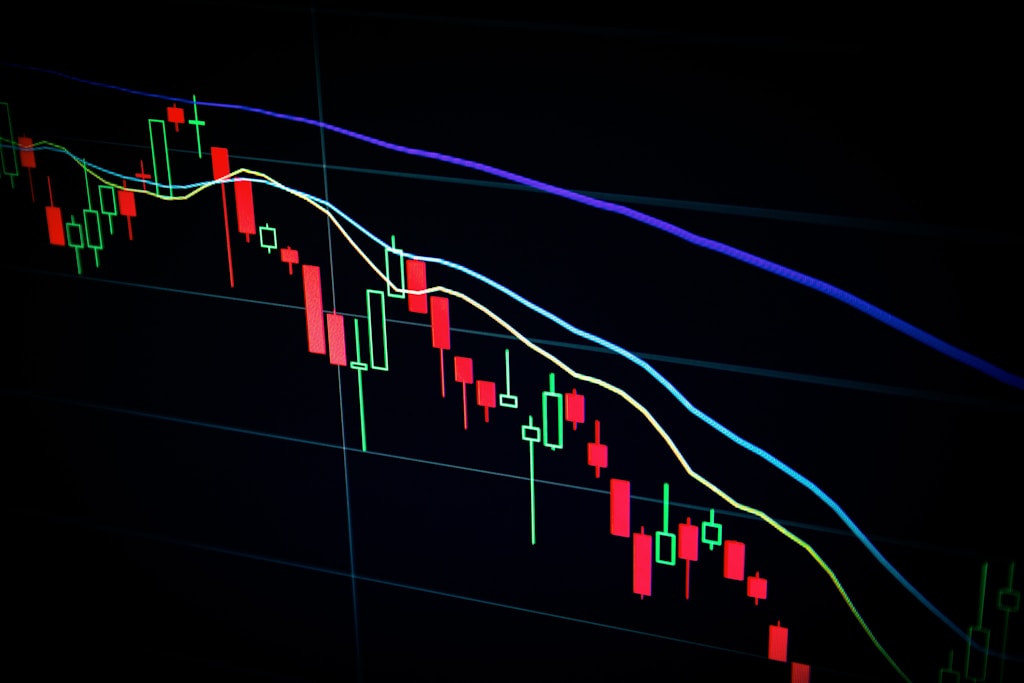
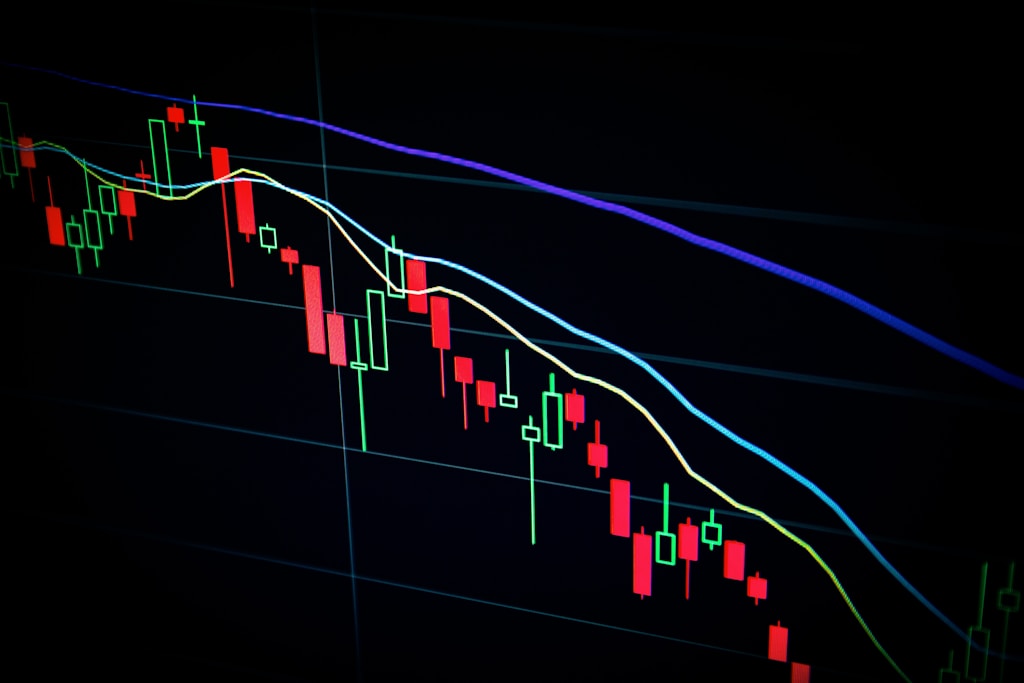
    Market analyst Thomas Anderson has identified a clear descending triangle formation on the M30 timeframe, with DOGE currently testing upper resistance around $0.19998. This critical technical structure is reinforced by multiple factors:

    • 200-period moving average acting as dynamic resistance
    • Declining volume during consolidation phase
    • Lower highs forming along the descending trendline
    • Horizontal support at $0.19010 showing early signs of weakness

    SPONSORED

    Trade DOGE with up to 100x leverage on perpetual contracts

    Trade Now on Defx

    Key Price Levels to Watch

    The immediate resistance level at $0.19998 represents a crucial battleground for bulls and bears. A decisive break above this level could invalidate the bearish setup and potentially trigger a relief rally. However, failure to breach this resistance could accelerate the downward pressure, targeting the following support zones:

    • Primary support: $0.19010
    • Secondary support: $0.18500
    • Last line of defense: $0.18000

    Volume Analysis and Market Sentiment

    Trading volume has shown a notable decline during this consolidation phase, typically a precursor to a significant price move. The compression of price action near the triangle’s apex suggests an explosive move could be imminent, with the direction likely determined by which level breaks first – resistance or support.

    FAQ: Critical Dogecoin Price Levels

    Q: What is the key resistance level for Dogecoin?
    A: The critical resistance level is currently at $0.19998, aligned with the descending triangle’s upper trendline.

    Q: Where is the main support level for DOGE?
    A: The primary support level sits at $0.19010, which has held firm during recent tests.

    Q: What could trigger a bullish reversal?
    A: A decisive break above $0.19998 with increased volume could invalidate the bearish pattern and trigger a recovery.

    Conclusion: Preparing for Volatility

    As Dogecoin approaches the apex of this descending triangle pattern, traders should prepare for increased volatility. While the technical structure suggests bearish pressure, the cryptocurrency market’s unpredictable nature means both scenarios remain possible. Risk management and proper position sizing become crucial during such technical setups.
  • Ethereum ETH/BTC Consolidation Signals Potential Altseason Breakout

    Ethereum ETH/BTC Consolidation Signals Potential Altseason Breakout

    Ethereum is showing remarkable resilience in the crypto market, maintaining critical support levels despite broader market volatility. While Bitcoin stagnates near $107,000, ETH’s stability and bullish structure are fueling optimism for a potential altcoin rally.

    ETHBTC Ratio: The Key Catalyst for Altseason

    The spotlight has shifted to a crucial technical indicator – the ETHBTC trading pair. According to prominent analyst Daan, this pair has established a tight consolidation range between 0.022 and 0.026 BTC. This pattern suggests accumulation and could be the springboard for significant market movements.

    SPONSORED

    Trade Ethereum with up to 100x leverage on perpetual contracts

    Trade Now on Defx

    Technical Analysis and Market Implications

    Currently trading at $2,640, ETH faces immediate resistance at the 200-day moving average ($2,676). A breakthrough above 0.026 on the ETHBTC chart could trigger substantial gains across various altcoin sectors:

    • DeFi protocols
    • ETH-based memecoins
    • Layer 2 solutions
    • Ethereum-adjacent ecosystems

    Support and Resistance Levels

    Key technical levels to watch:

    Type Level Significance
    Resistance $2,700 Primary breakout target
    Support $2,500 Current foundation
    Critical Support $2,350-2,400 MA convergence zone

    FAQ Section

    What could trigger an altseason?

    A decisive break above 0.026 on the ETHBTC pair, combined with sustained ETH strength above $2,700, could catalyze broad altcoin momentum.

    What are the risks to watch?

    A drop below 0.0224 on ETHBTC could signal weakness for altcoins, even if USD prices remain stable during aggressive Bitcoin rallies.

    The current market structure suggests Ethereum is positioned for a potential breakout, but traders should monitor both USD and BTC pairs for confirmation signals. Recent protocol developments could provide additional catalysts for upward momentum.

  • XRP Price Consolidates at $2.25: Key Oscillator Signals Flash Warning

    Key Takeaways:

    • XRP trading at $2.25 with $131B market cap
    • 24-hour volume reaches $2.26B amid tight consolidation
    • Technical indicators suggest cautious approach despite bullish setup

    XRP continues to navigate a critical price zone as the digital asset trades at $2.25, showing signs of both opportunity and caution for traders. This analysis comes at an interesting time, particularly as Ripple expands its presence in the Middle East with its RLUSD stablecoin.

    The cryptocurrency’s market capitalization stands firm at $131 billion, while maintaining a healthy 24-hour trading volume of $2.26 billion. The current price action suggests a period of consolidation, with intraday movements confined between $2.23 and $2.28.

    Technical Analysis: Mixed Signals Emerge

    The 1-hour chart reveals a tight consolidation pattern between $2.24 and $2.26, presenting a classic scalping setup. However, key oscillators are flashing warning signs that deserve attention:

    • RSI: Showing slight bearish divergence
    • MACD: Histogram suggesting decreasing momentum
    • Volume Profile: Below average, indicating potential lack of conviction

    SPONSORED

    Trade XRP with precision using advanced charting tools and deep liquidity

    Trade Now on Defx

    Support and Resistance Levels

    Critical levels to watch:

    Support Resistance
    $2.23 $2.28
    $2.20 $2.30
    $2.15 $2.35

    Market Sentiment and Outlook

    While the immediate setup appears conducive for scalping opportunities, traders should exercise caution given the mixed signals from oscillators. The current consolidation phase could precede a significant move in either direction.

    FAQ

    Q: What’s causing XRP’s current consolidation?
    A: The tight trading range appears to be influenced by broader market uncertainty and technical resistance levels.

    Q: Is this a good entry point for traders?
    A: While scalping opportunities exist, the conflicting technical signals suggest waiting for clearer directional confirmation.

    Q: What are the key levels to watch?
    A: The immediate support at $2.23 and resistance at $2.28 are crucial for short-term price action.

  • Bitcoin Dominance at 64% Signals Potential Altcoin Season Breakout

    Bitcoin’s dominance metric (BTC.D) has reached a critical technical level at 64%, potentially signaling a major shift in market dynamics that could trigger the next altcoin season. As Bitcoin continues to defend the $105,500 support level, market participants are closely monitoring emerging patterns that could reshape the crypto landscape.

    Technical Analysis Points to Possible BTC.D Reversal

    According to certified Level III CMT analyst Tony “The Bull” Severino, the Bitcoin dominance chart is showing significant technical warning signs at the 64% threshold. The formation of a Doji candlestick at a previous Falling Window support zone suggests the potential for a meaningful reversal in Bitcoin’s market dominance.

    Key technical indicators include:

    • Monthly Doji formation at critical resistance
    • RSI readings above 70 indicating overbought conditions
    • Potential Evening Star pattern formation
    • Critical 62% support level to watch

    Market Structure Analysis

    The current market structure presents a compelling case for a potential shift in capital flows. Recent analysis suggests that key support levels could indeed trigger a significant altcoin rally, aligning with the technical patterns observed in the BTC.D chart.

    SPONSORED

    Maximize your trading potential with up to 100x leverage on perpetual contracts

    Trade Now on Defx

    Current Market Conditions

    At present, Bitcoin trades at $105,500, showing minimal movement (-0.1%) over the past 24 hours. The cryptocurrency’s market dominance has declined to 63.1%, representing a 0.57% decrease. Meanwhile, Ethereum has gained ground, increasing its market share by 2.13% to reach 9.6%.

    Expert Outlook and Trading Implications

    While the technical setup suggests a potential altcoin season, Severino maintains a cautious stance, noting that traditional altcoin season characteristics may not fully materialize. Traders should watch for:

    • A monthly close below 62% BTC.D as confirmation
    • Evening Star pattern completion
    • RSI divergence signals
    • Volume confirmation of trend changes

    Frequently Asked Questions

    What is Bitcoin Dominance (BTC.D)?

    Bitcoin Dominance represents Bitcoin’s market capitalization as a percentage of the total cryptocurrency market capitalization, serving as a key indicator of Bitcoin’s relative strength against altcoins.

    What signals an altcoin season?

    An altcoin season typically begins when Bitcoin’s dominance shows a sustained decline, accompanied by increasing altcoin market share and trading volumes.

    How reliable are Doji patterns in crypto markets?

    Doji patterns are considered reliable technical indicators in crypto markets, especially when they appear on higher timeframes (daily, weekly, monthly) and coincide with other technical signals.

  • Solana Price Eyes $300 Target as Bulls Battle $160 Resistance

    Solana (SOL) continues to face stiff resistance at the $160 level despite multiple attempts to break higher, as broader market momentum shows signs of weakening. The leading cryptocurrency has struggled to maintain upward momentum, with Bitcoin and Ethereum also battling key resistance levels around $2,660, raising concerns about a potential market-wide correction.

    However, prominent crypto analyst Kaleo remains optimistic about SOL’s long-term prospects, setting an ambitious $300 price target that would represent nearly a 100% gain from current levels. This bullish outlook comes amid growing institutional interest in Solana’s ecosystem, as highlighted by the recent $500 million SOL investment from a major EdTech firm.

    Technical Analysis Points to Consolidation Phase

    SOL is currently trading at $157.46, showing modest stability after bouncing from recent lows near $154. Key technical indicators suggest a period of consolidation:

    • 34-day EMA acting as dynamic resistance at $162
    • 200-day SMA resistance at $178.88
    • Critical support holding at $150
    • Volume remains muted, indicating lack of strong directional bias

    SPONSORED

    Trade Solana with up to 100x leverage on perpetual contracts

    Trade Now on Defx

    Path to $300: Key Levels to Watch

    For SOL to achieve Kaleo’s $300 target, several technical hurdles must be cleared:

    1. Break above immediate resistance at $162-165
    2. Reclaim the 200-day SMA at $178.88
    3. Clear psychological resistance at $200
    4. Establish support above previous swing highs

    Market Factors Supporting Bullish Case

    Several fundamental factors support the potential for higher prices:

    • Growing institutional adoption of Solana’s ecosystem
    • Increasing DeFi and NFT activity on the network
    • Technical improvements reducing network outages
    • Rising transaction volumes and daily active users

    Risk Factors to Consider

    Investors should remain mindful of potential risks:

    • Broader market uncertainty and correlation with Bitcoin
    • Technical resistance at multiple levels
    • Potential macro headwinds affecting risk assets
    • Competition from other Layer-1 protocols

    The short-term outlook remains neutral-to-bearish unless SOL can decisively break above $165 with strong volume. However, the long-term fundamental case for Solana continues to strengthen, supporting the possibility of reaching the $300 target once market conditions improve.

  • Bitcoin Price Defends $105K Support as Bulls Battle Key Resistance

    Bitcoin Price Defends $105K Support as Bulls Battle Key Resistance

    Bitcoin (BTC) continues to show resilience at the critical $105,000 support level, with bulls maintaining their defensive position despite cooling momentum in the broader crypto market. As long-term holders reduce their selling pressure at these levels, the leading cryptocurrency faces a crucial test of market sentiment.

    Bitcoin Price Analysis: Key Technical Levels

    As of June 4, 2025, Bitcoin is trading at $105,289, representing a slight pullback from the recent high of $106,854. Key metrics include:

    • Market Capitalization: $2.09 trillion
    • 24-hour Trading Volume: $24.92 billion
    • Daily Trading Range: $105,293 – $106,854

    Technical Indicators and Market Structure

    The one-hour chart reveals a developing micro downtrend, characterized by:

    • Formation of lower highs and lower lows
    • Critical support at $105,000
    • Resistance zone between $106,800 – $107,000

    SPONSORED

    Trade Bitcoin with up to 100x leverage on perpetual contracts

    Trade Now on Defx

    Market Sentiment and Volume Analysis

    The current price action aligns with recent analysis suggesting a potential consolidation phase before the next major move. As noted in our recent coverage of Bitcoin’s path to $140,000, the $106,000 level represents a crucial resistance zone that could determine the medium-term trend.

    Expert Outlook and Price Targets

    Market analysts remain cautiously optimistic, with key levels to watch:

    • Immediate Support: $105,000
    • Secondary Support: $103,500
    • Primary Resistance: $106,854
    • Major Resistance: $107,500

    Frequently Asked Questions

    What is causing Bitcoin’s current price consolidation?

    The consolidation appears driven by a combination of profit-taking at higher levels and renewed accumulation by institutional investors at support.

    Could Bitcoin break below $105,000 support?

    While possible, strong buyer interest and reduced selling pressure from long-term holders make a sustained break below this level less likely in the immediate term.

    What are the key levels to watch for a breakout?

    A decisive move above $107,000 could trigger a rally toward $110,000, while a break below $105,000 might test support at $103,500.

    Traders should maintain strict risk management practices given the current market conditions and watch for volume confirmation on any breakout attempts.

  • Bitcoin Price Alert: $98K Support Level Could Trigger Major Altcoin Rally

    Bitcoin Price Alert: $98K Support Level Could Trigger Major Altcoin Rally

    Bitcoin’s price trajectory is showing signs of a potential correction after reaching new heights above $100,000. While the leading cryptocurrency maintains bullish momentum, technical analysis suggests an imminent retracement that could present significant buying opportunities across the crypto market.

    Technical Analysis Points to Strategic Bitcoin Price Levels

    According to respected crypto analyst Xanrox, Bitcoin is breaking down from an ascending parallel channel that formed during its climb from $74,000 to $112,000. This technical pattern, combined with recent resistance tests at the $107,000 level, suggests a corrective phase may be imminent.

    Key technical factors supporting this analysis include:

    • Formation of a symmetrical triangle pattern within the channel
    • Completion of five Elliott Wave theory waves
    • Multiple unfilled Fair Value Gaps (FVG)
    • Critical Fibonacci retracement levels at $98,000, $92,000, and $87,500

    Strategic Buying Zones Identified

    The analysis points to three potential buying zones based on Fibonacci retracement levels:

    • Primary support: $98,000 (0.382 Fibonacci level)
    • Secondary support: $92,000 (0.500 Fibonacci level)
    • Final support: $87,500 (0.618 Fibonacci level)

    SPONSORED

    Trade Bitcoin with up to 100x leverage and maximize your profit potential

    Trade Now on Defx

    Implications for Altcoin Markets

    The anticipated Bitcoin correction could create prime buying opportunities in the altcoin market. As historically observed, significant Bitcoin price movements often precede larger percentage moves in alternative cryptocurrencies. Recent data showing decreased selling pressure from long-term holders suggests the correction may be relatively short-lived.

    FAQ: Key Points for Traders

    When should investors consider entering positions?

    The first major buying opportunity presents itself at the $98,000 level, coinciding with the 0.382 Fibonacci retracement.

    What indicators support this analysis?

    Multiple technical factors including Elliott Wave completion, symmetrical triangle formation, and unfilled Fair Value Gaps support the correction thesis.

    How might this affect altcoin prices?

    Altcoins typically experience more significant percentage moves during Bitcoin corrections, potentially offering enhanced buying opportunities.

    As the market prepares for this potential correction, traders should maintain strict risk management practices and consider dollar-cost averaging into positions at the identified support levels.

  • XRP Price Analysis: $19 Target Still in Play Despite Market Compression

    XRP Price Analysis: $19 Target Still in Play Despite Market Compression

    A comprehensive technical analysis from crypto analyst Maelius suggests XRP could be setting up for a massive rally to $19, even in a worst-case scenario. The analysis, which draws striking parallels to XRP’s 2017 bull run, identifies a “giga bull flag” pattern that could trigger significant upside momentum.

    Technical Setup Mirrors 2017 Bull Run

    The current weekly chart structure shows XRP trading at $2.25, maintaining position above the critical 50-period EMA at $1.78. The token has formed a clear bull flag pattern over the past four months, with lower highs capping at $3.40 and higher lows finding support near $1.61.

    This compression mirrors the setup seen before XRP’s historic 2017 surge, where the token exploded from sub-dollar prices to over $3.00 in mere weeks. The potential for an alt season breakout adds further weight to this bullish scenario.

    SPONSORED

    Trade XRP with up to 100x leverage on perpetual contracts

    Trade Now on Defx

    Key Price Levels and RSI Analysis

    Critical support levels include:

    • Upper flag boundary: $2.50
    • EMA support: $1.80
    • Secondary support: $1.30

    The RSI indicator shows similar patterns to 2017, with two distinct peaks separated by a consolidation phase. The current RSI reading has cooled to mid-40s after reaching the high-80s, suggesting room for another momentum surge.

    Potential Breakout Scenarios

    A weekly close above $2.50 could trigger a cascade of technical breakouts targeting:

    • Initial resistance: $4.40
    • Secondary target: $6.00
    • Ultimate target: $19.00

    Risk Factors and Market Conditions

    While the technical setup appears promising, traders should consider:

    • Volume confirmation needed
    • Broader market sentiment impact
    • Support level integrity at $1.80

    FAQ Section

    Q: What could invalidate this bullish scenario?
    A: A decisive break below the $1.80 EMA support would invalidate the pattern.

    Q: How long might this rally take to materialize?
    A: Based on historical patterns, significant moves can occur within weeks once key resistance breaks.

    Q: What’s the significance of the $19 target?
    A: This level represents the projection based on the 2017 fractal pattern scaled to current market conditions.

    At time of writing, XRP trades at $2.23, maintaining its position above key moving averages while the market awaits potential catalysts for the next major move.

  • Bitcoin Price Stagnates at $107K While Ethereum Eyes $2,660 Breakout

    Bitcoin Price Stagnates at $107K While Ethereum Eyes $2,660 Breakout

    Bitcoin continues to consolidate between $107,000-$108,000 as market participants await a clear directional move. Meanwhile, Ethereum shows increasing strength with its third attempt at breaking the crucial $2,660 resistance level, potentially signaling a shift in market dynamics.

    Bitcoin’s Tight Range Trading Continues

    As discussed in our recent analysis Bitcoin Price Tests $107K Resistance: Key Levels for June Breakout, BTC remains confined in a narrow trading range. The cryptocurrency faces overhead resistance between $107,500-$108,000, while strong support keeps the price from declining significantly.

    Technical indicators suggest:

    • Descending resistance around $107,500-$108,000 blocking upward momentum
    • Unbroken support levels maintaining price stability
    • Neutral liquidation heatmap showing balanced positions
    • Potential for an impulsive move once consolidation ends

    Ethereum Shows Leadership with Bullish Setup

    While Bitcoin consolidates, Ethereum displays notable strength as it approaches the critical $2,660 level for the third time. This price action aligns with predictions from our previous analysis of ETH’s potential breakout.

    Key bullish indicators for Ethereum include:

    • Positive RSI structure on 4-hour timeframe
    • Breaking downtrend line in RSI
    • Improving ETH/BTC ratio
    • Strong performance of Ethereum ETFs versus Bitcoin ETFs

    SPONSORED

    Trade Ethereum with up to 100x leverage on perpetual contracts

    Trade Now on Defx

    Market Implications and Future Outlook

    The current market structure suggests a potential transition from Bitcoin dominance to increased risk appetite in the altcoin sector. This shift could trigger significant capital flows into smaller projects and meme coins.

    Tom Lee of Fundstrat maintains his bullish outlook, as detailed in his recent prediction of Bitcoin reaching $250K in 2025.

    FAQ Section

    Q: Why is Bitcoin stuck in a range?
    A: The market is experiencing balanced buying and selling pressure, with neither bulls nor bears having sufficient strength to break the current equilibrium.

    Q: What could trigger an Ethereum breakout?
    A: A successful break above $2,660 with increased volume could trigger a significant rally, especially given the positive RSI structure and improving ETH/BTC ratio.

    Q: How does this affect the broader crypto market?
    A: Ethereum’s strength could signal the start of an altcoin season, potentially leading to increased capital flows into smaller cryptocurrencies.

  • Bitcoin Price Mirrors Gold Rally: M2 Money Supply Signals $130K Target

    Bitcoin Price Mirrors Gold Rally: M2 Money Supply Signals $130K Target

    Bitcoin (BTC) is showing increasingly strong correlations with traditional safe-haven assets, particularly gold and the global M2 money supply, suggesting a potential major rally ahead for the leading cryptocurrency. Recent technical indicators and institutional endorsements are painting a bullish picture for Bitcoin’s near-term trajectory.

    Bitcoin’s Growing Correlation with Traditional Safe Havens

    According to recent analysis shared by crypto analyst Jelle, Bitcoin’s price movements are closely tracking gold’s historical performance patterns. This relationship has become particularly noteworthy as Bitcoin tests critical resistance levels around $107,000, with gold leading the way in price action.

    BlackRock’s Head of Digital Assets, Robert Mitchnick, recently strengthened Bitcoin’s position by describing it as a “superior alternative” to gold – a significant endorsement from the world’s largest asset manager that could drive institutional adoption.

    M2 Money Supply Correlation Suggests Imminent Rally

    Analyst CryptoGoos has identified a compelling pattern between Bitcoin’s price action and global M2 money supply movements. Historical data shows Bitcoin typically lags M2 increases by approximately two months, suggesting we could be on the cusp of another significant price surge.

    SPONSORED

    Trade Bitcoin with up to 100x leverage and maximize your profit potential

    Trade Now on Defx

    Technical Indicators Support Bullish Outlook

    Multiple technical indicators are aligning to support the bullish case. A golden cross formation has appeared on the four-hour chart, historically a reliable predictor of upward price movement. Additionally, analysts are predicting substantial capital inflows this summer, which could fuel the next leg up.

    Price Targets and Risk Factors

    While multiple analysts project targets between $120,000 and $130,000, investors should remain vigilant of key support levels. A break below the $97,000-$99,000 range could trigger a deeper correction. Currently trading at $106,610, Bitcoin shows strong momentum but faces immediate resistance at $107,000.

    FAQ Section

    Q: What is the relationship between Bitcoin and M2 money supply?
    A: Bitcoin typically follows M2 money supply increases with a two-month lag, suggesting potential price appreciation when M2 expands.

    Q: What is a golden cross and why is it significant?
    A: A golden cross occurs when a short-term moving average crosses above a long-term moving average, typically signaling a bullish trend continuation.

    Q: What are the key support levels to watch?
    A: The critical support zone lies between $97,000 and $99,000, with a break below potentially triggering a deeper correction.