Tag: technical analysis

  • Ethereum Price Tests $2,650 Resistance – Key Breakout Levels Ahead

    Ethereum Price Tests $2,650 Resistance – Key Breakout Levels Ahead

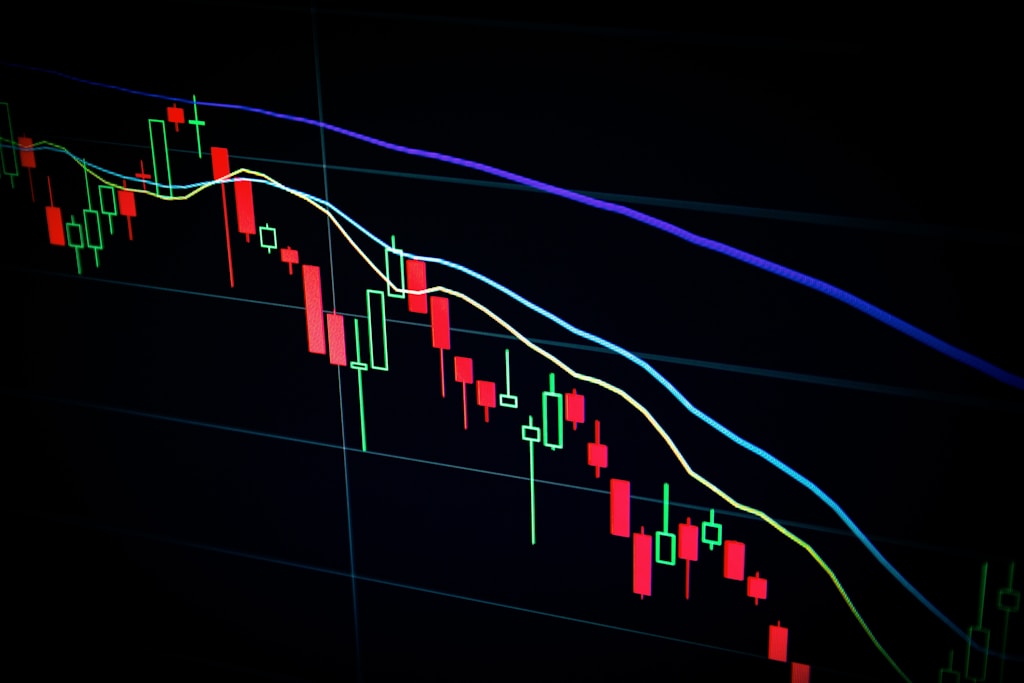
    Ethereum (ETH) has reclaimed a pivotal price level above $2,600, setting up a potential breakout scenario that could ignite the long-anticipated altcoin season. Recent historical data suggests we’re approaching a major market shift, with ETH’s current price action potentially serving as the catalyst.

    The second-largest cryptocurrency by market cap is showing remarkable resilience despite broader market uncertainty, maintaining critical support above $2,500. Technical indicators point to growing momentum as ETH approaches the key $2,650 resistance level that has repeatedly capped previous rally attempts.

    Technical Analysis Shows Bullish Setup

    According to prominent analyst Daan, Ethereum is currently testing a major resistance zone around $2,650. A successful break above this level could trigger renewed buying pressure and potentially spark the next leg up in the ongoing bull cycle. This technical setup aligns with Ethereum’s ambitious scaling roadmap, which could drive significant value appreciation over the coming months.

    SPONSORED

    Trade ETH with up to 100x leverage and maximize your profit potential

    Trade Now on Defx

    Key Price Levels to Watch

    Current support and resistance levels for ETH:

    • Strong support: $2,500
    • Immediate resistance: $2,650
    • Secondary resistance: $2,700
    • 200 SMA support: $2,380

    Market Implications

    The broader crypto market remains cautiously optimistic, with Ethereum’s strength potentially signaling the start of an altcoin season. ETH’s ability to maintain prices above $2,500 despite macroeconomic headwinds demonstrates underlying market resilience.

    FAQ

    Q: What happens if ETH breaks above $2,650?
    A successful break above $2,650 could trigger a rally toward $2,700 and potentially higher levels.

    Q: What’s the significance of the current consolidation?
    The consolidation between $2,500-$2,700 is building a strong base for potential future price appreciation.

    Q: How does this affect the broader altcoin market?
    Ethereum’s breakout could catalyze broader altcoin market gains, potentially marking the start of altseason.

  • Shiba Inu Price Alert: Triangle Pattern Signals 20% Drop Ahead

    Shiba Inu Price Alert: Triangle Pattern Signals 20% Drop Ahead

    Shiba Inu (SHIB) faces a critical technical setup as multiple analysts identify bearish patterns that could trigger a significant price decline. This analysis comes amid broader volatility in the meme coin market, which has seen dramatic shifts in June 2025.

    Technical Analysis Points to Bearish Momentum

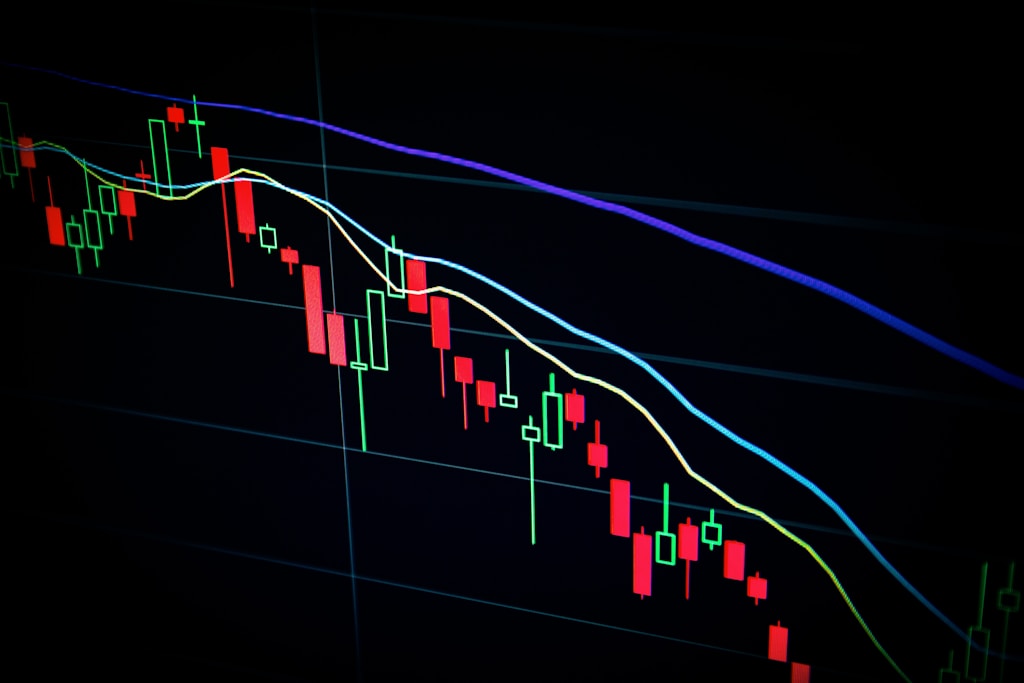
    Crypto analyst Smart Trading has identified a concerning triangle formation in SHIB’s price action, suggesting an imminent 20% downward movement. The breakdown below the triangle pattern after consolidation near key resistance levels presents a clear bearish signal for traders.

    Key price levels to monitor:

    • Current resistance: $0.00001396
    • Critical support: $0.00001041
    • Current price: $0.00001322

    SPONSORED

    Trade meme coins with up to 100x leverage on perpetual contracts

    Trade Now on Defx

    Multiple Analysts Confirm Bearish Outlook

    Paper Trader’s analysis aligns with the bearish sentiment, noting SHIB’s precarious position in a demand zone. The analyst suggests that failure to hold above $0.00001300 could trigger a cascade of selling pressure toward $0.00001100.

    Contrarian View: Potential Bottom Formation

    However, analyst GKTrademanthan presents a contrarian perspective, identifying a potential bottom formation through a four-stage pattern analysis:

    1. Falling wedge (completed)
    2. Cup and Handle pattern (completed)
    3. W Pattern (completed)
    4. Inverted Head and Shoulders (pending)

    Market Performance Context

    SHIB’s current struggles reflect broader market challenges, with the token down 38% year-to-date. Despite this decline, the meme coin maintains its position as the 19th largest cryptocurrency by market capitalization.

    FAQ Section

    What is causing Shiba Inu’s current price decline?

    Technical analysis suggests a breakdown from a triangle pattern, combined with broader market weakness and declining meme coin momentum.

    What are the key support levels to watch?

    The critical support level is at $0.00001041, with an intermediate support at $0.00001100.

    Is there any bullish case for SHIB?

    Yes, some analysts identify a potential bottom formation through pattern analysis, suggesting a possible 90% upside to $0.00002431 if certain technical conditions are met.

  • Ethereum Price Signals $2,000 Drop: Key Support Levels Revealed

    In what appears to be a significant shift in market sentiment, Ethereum’s recent bullish momentum may be coming to an end, with technical indicators suggesting a potential drop to the $2,000 level. This analysis comes at a crucial time when the cryptocurrency market shows increasing signs of volatility.

    Technical Analysis Points to Bearish Continuation

    According to respected TradingView analyst Master Ananda, Ethereum’s price action is displaying concerning signals as it struggles below critical resistance. Currently trading at $2,605, ETH recently faced rejection from $2,788, establishing what appears to be a local top.

    SPONSORED

    Trade ETH with up to 100x leverage and maximize your profit potential

    Trade Now on Defx

    Critical Support Levels to Watch

    The analysis identifies several key Fibonacci retracement levels that could act as support:

    • $2,280 (0.382 Fibonacci level)
    • $2,085 (0.5 Fibonacci level)
    • $1,900 (0.618 Fibonacci level)
    • $1,735 (0.786 Fibonacci level)

    Trading Strategy and Risk Management

    For traders looking to capitalize on this potential movement, Master Ananda suggests a strategic approach:

    1. Wait for confirmation of support at key levels
    2. Look for entry points between $1,900 and $1,735
    3. Set stop losses below the April 7 low
    4. Consider dollar-cost averaging into positions

    Long-term Outlook Remains Positive

    Despite the short-term bearish outlook, Ethereum’s long-term growth potential remains strong, with ongoing network developments and institutional adoption continuing to provide fundamental support.

    Frequently Asked Questions

    Q: What is causing Ethereum’s potential price drop?
    A: Technical indicators, including bearish divergence and Fibonacci retracement levels, suggest a correction is due after recent price increases.

    Q: How low could Ethereum price go?
    A: Technical analysis suggests potential support levels at $2,280, $2,085, and possibly as low as $1,900.

    Q: Is this a good time to buy Ethereum?
    A: While the short-term outlook suggests waiting for lower prices, strategic entries at support levels could provide good long-term opportunities.

  • Altcoin Golden Cross Signals Potential 2025 Alt Season Breakout

    The cryptocurrency market is witnessing a significant technical development as the altcoin market capitalization forms a golden cross pattern, potentially signaling the start of a highly anticipated altcoin season. While Bitcoin continues its dominance above $100,000, this technical indicator suggests alternative cryptocurrencies may be preparing for a substantial rally.

    Understanding the Altcoin Golden Cross Formation

    Market expert Ted Pillows has identified a crucial golden cross formation on the altcoin market cap chart, coinciding with historical data patterns that previously preceded major altcoin rallies. This technical pattern occurs when a short-term moving average crosses above a longer-term moving average, typically signaling a shift from bearish to bullish momentum.

    SPONSORED

    Trade meme coins with up to 100x leverage and maximize your alt season gains

    Trade Now on Defx

    Key Technical Indicators Supporting the Altcoin Surge

    The altcoin market has been showing remarkable resilience, maintaining positions above both the 50 and 200-day EMAs since May. This consolidation phase, combined with the golden cross, suggests accumulation before a potential breakout. On-chain analyst Joao Wedson notes that many altcoins are decoupling from Bitcoin’s price action, a phenomenon historically associated with alt season beginnings.

    Market Implications and Trading Opportunities

    With Bitcoin trading above $100,000, the altcoin market’s technical setup suggests a potential redistribution of capital from BTC to alternative cryptocurrencies. This shift could trigger significant price appreciation across the altcoin market, particularly for projects with strong fundamentals and utility.

    Frequently Asked Questions

    What is a Golden Cross in Crypto Markets?

    A golden cross occurs when a short-term moving average crosses above a long-term moving average, typically signaling the potential start of a bullish trend.

    How Long Do Altcoin Seasons Typically Last?

    Historical data shows altcoin seasons can last anywhere from 3-6 months, though market conditions in 2025 may differ from previous cycles.

    What Triggers an Altcoin Season?

    Altcoin seasons are often triggered by Bitcoin price stabilization, increased market confidence, and capital rotation from BTC to alternative cryptocurrencies.

    Investors should maintain careful risk management practices despite the bullish technical indicators, as cryptocurrency markets remain highly volatile and subject to rapid changes in sentiment.

  • BNB Price Coils Below $670: Key Breakout Levels to Watch

    BNB Price Coils Below $670: Key Breakout Levels to Watch

    BNB, Binance’s native token, is showing signs of a potential major breakout as it tests critical resistance levels. According to prominent crypto analyst Wise Crypto, the asset is approaching a decisive technical juncture that could determine its next significant move.

    Technical Analysis Shows Building Pressure

    The weekly chart for BNB reveals an increasingly tight coiling pattern against the crucial $670 resistance zone – a level that has historically served as a formidable ceiling for the token. This technical formation, combined with rising volume indicators, suggests mounting pressure that could catalyze a powerful upward movement.

    Similar to how historical data has revealed surprising market shifts in the altcoin sector, BNB’s current pattern formation could signal an impending trend change.

    Key Price Targets and Resistance Levels

    If BNB successfully breaks above the $670 resistance, several key target levels come into focus:

    • Initial resistance: $710
    • Secondary target: $742
    • Ultimate goal: $800 (Previous all-time high)

    SPONSORED

    Trade BNB with up to 100x leverage on perpetual contracts

    Trade Now on Defx

    Volume Analysis and Market Momentum

    Trading volume has begun showing signs of acceleration, a crucial indicator that typically precedes significant price movements. The current volume profile suggests accumulation at these levels, with smart money potentially positioning for the next leg up.

    Fundamental Catalysts Supporting the Move

    Beyond technical indicators, several fundamental factors support BNB’s bullish case:

    • Binance’s continued market dominance
    • Growing utility within the BNB ecosystem
    • Increasing institutional interest in major altcoins

    Critical Confirmation Signals

    Traders should watch for these key confirmation signals:

    • Weekly close above $670
    • Sustained volume increase
    • Holding support at $710 after initial breakout

    FAQ Section

    What makes the $670 level so significant for BNB?

    This price point has acted as strong resistance multiple times, making it a psychological and technical barrier that, if broken, could trigger significant buying pressure.

    How long could this breakout take to materialize?

    While timing markets is challenging, the coiling pattern suggests a resolution within the next 2-4 weeks based on historical patterns.

    What are the main risks to this bullish scenario?

    Key risks include broader market volatility, regulatory news affecting Binance, or failure to maintain support levels after initial breakout attempts.

  • Bitcoin Price Surges Past $106K as Stock Market Rally Fuels Crypto Gains

    Bitcoin Price Surges Past $106K as Stock Market Rally Fuels Crypto Gains

    Key Takeaways:

    • Bitcoin reached $106,813.58 during Tuesday’s trading session
    • Stock market rally, particularly in tech sector, supports crypto gains
    • Market correlation between traditional and crypto assets strengthens

    Bitcoin’s upward momentum continued on Tuesday as the leading cryptocurrency surged past the $106,000 mark, riding alongside positive movements in both traditional stock markets and the broader cryptocurrency sector. This price action aligns with recent technical analysis suggesting a potential push toward $110,000.

    Market Correlation Strengthens

    The cryptocurrency market’s close correlation with traditional financial markets was evident as Bitcoin’s rise coincided with significant gains in major stock indices. The S&P 500’s tech sector led the broader market rally, demonstrating the increasingly interconnected nature of digital and traditional assets.

    SPONSORED

    Maximize your trading potential with up to 100x leverage on perpetual contracts

    Trade Now on Defx

    Institutional Interest Grows

    The latest price movement comes amid increasing institutional adoption, as highlighted by recent data showing whale accumulation of $8.3B worth of BTC. This institutional backing provides crucial support for Bitcoin’s current price levels.

    Technical Analysis

    Key resistance levels now sit at:

    • $107,000
    • $108,500
    • $110,000

    Market Outlook

    While the immediate trend remains bullish, traders should monitor:

    • Stock market correlation
    • Institutional flow data
    • Technical resistance levels

    FAQ

    Q: What’s driving Bitcoin’s current price increase?
    A: The rally is supported by positive stock market performance, particularly in tech stocks, and continued institutional interest.

    Q: How does this compare to previous rallies?
    A: This rally shows stronger correlation with traditional markets and more substantial institutional backing than previous upward movements.

    Q: What are the key resistance levels to watch?
    A: The primary resistance levels are at $107,000, $108,500, and the psychological barrier at $110,000.

  • Bitcoin Price Warning: Head & Shoulders Pattern Targets $95K Drop

    Bitcoin’s recent price action has triggered a major technical warning signal, with a prominent Head and Shoulders pattern suggesting an imminent drop to $95,000. This development comes just days after Bitcoin’s volatile push to $111K sparked analyst warnings about potential price swings.

    Critical Technical Pattern Emerges on Bitcoin Charts

    Crypto Patel, a respected technical analyst on X (formerly Twitter), has identified a concerning Head and Shoulders formation on Bitcoin’s 3-hour chart. This classic bearish reversal pattern typically signals the end of an uptrend and could trigger a significant correction in BTC’s price.

    SPONSORED

    Trade Bitcoin with up to 100x leverage and maximize your profit potential

    Trade Now on Defx

    Key Price Levels to Watch

    Currently trading at $105,409, Bitcoin faces several critical support levels:

    • Neckline support: $103,000
    • Primary target: $95,000 (9.87% potential drop)
    • Secondary support zone: $94,600-$93,600

    Market Implications and Trading Opportunities

    While the short-term outlook appears bearish, this potential correction could present a strategic buying opportunity for long-term investors. The $95,000 support zone is likely to attract significant buying interest, especially considering Bitcoin’s recent all-time high near $112,000.

    Expert Analysis and Price Targets

    According to Crypto Patel’s technical analysis, the breakdown scenario will only activate if Bitcoin closes below the crucial $103,000 neckline. This level represents the last line of defense before a potential cascade to $95,000.

    Frequently Asked Questions

    What is a Head and Shoulders pattern?

    A Head and Shoulders pattern is a technical chart formation consisting of three peaks, with the middle peak (head) being higher than the two outer peaks (shoulders). It’s considered one of the most reliable bearish reversal patterns in technical analysis.

    How reliable is this pattern for Bitcoin?

    Historical data shows that Head and Shoulders patterns in Bitcoin have approximately a 68% success rate when properly formed and confirmed with volume.

    What could invalidate this bearish scenario?

    A sustained close above $106,000 would likely invalidate the pattern and could trigger a continuation of the bullish trend.

  • XRP Price Alert: Key June 4-6 Window Could Signal Major Breakout

    XRP Price Alert: Key June 4-6 Window Could Signal Major Breakout

    XRP’s price action is approaching a critical juncture as the cryptocurrency attempts to break above $2.20 following recent volatility. After reaching $2.65 in May before retracing to $2.10, crypto analysts are now highlighting a specific timeframe that could determine XRP’s next major move.

    Critical Price Action Window: June 4-6

    Crypto analyst WatersAbove has identified June 4-6 as a potential bottom formation period for XRP, suggesting this window could precede significant upside movement. The analyst warns that this period may see increased market manipulation as larger players attempt to shake out weak hands before a possible rally.

    SPONSORED

    Trade XRP with up to 100x leverage on perpetual contracts

    Trade Now on Defx

    Ambitious Price Targets and Market Analysis

    The most striking aspect of WatersAbove’s analysis is the projected price target of $10 by late July or early August 2025. This ambitious prediction aligns with recent technical analysis suggesting significant upside potential for XRP, though with more conservative targets.

    Multiple Analysts Weigh In

    Supporting this bullish outlook, EGRAG CRYPTO and Dark Defender have provided additional technical analysis suggesting potential moves to the $18-23 range. However, contrasting views exist, with analyst Dr Cat suggesting any significant bull run might be delayed until November 2025.

    Current Market Position

    XRP currently trades at $2.20, showing a 1.63% increase over 24 hours. The projected $10 target would represent a 350% increase from current levels, requiring substantial institutional inflows to achieve.

    FAQ Section

    What makes June 4-6 significant for XRP?

    This period is identified as a potential bottom formation window with increased manipulation risk before a possible breakout.

    What technical indicators support the $10 price target?

    Analysts point to historical price patterns, wave count analysis, and institutional buying patterns as supporting factors.

    How does this prediction compare to previous XRP rallies?

    The projected movement would mirror XRP’s Q4 2024 rally and 2018 performance, though requiring significantly more institutional participation.

  • Bitcoin Price Holds $105K Support Despite 6% Drop: Green Mining Boost

    Bitcoin Price Holds $105K Support Despite 6% Drop: Green Mining Boost

    Bitcoin has demonstrated remarkable resilience after its recent surge to $112K, maintaining strong support above $105K despite a 6% correction. The leading cryptocurrency’s fundamentals remain robust, bolstered by innovative green mining initiatives in Nigeria that could reshape the narrative around Bitcoin’s environmental impact.

    Bitcoin’s Technical Outlook Remains Strong

    After an impressive 50% rally over 45 days that pushed Bitcoin to a new all-time high near $112K, the cryptocurrency has entered what appears to be a healthy consolidation phase. Recent analysis warned of potential price swings following the $111K ATH, but current market indicators suggest this pullback represents a necessary cooling period rather than a trend reversal.

    Nigerian Green Mining Initiative Tackles Environmental Concerns

    In a significant development for Bitcoin’s sustainability narrative, Nigerian startup Green Flare is launching an innovative project to convert harmful gas flares into Bitcoin mining power. This initiative directly addresses one of the most persistent criticisms of Bitcoin – its energy consumption.

    The project will:

    • Generate 53MW of energy for Bitcoin mining
    • Reduce Nigeria’s gas flaring emissions
    • Convert waste energy into productive mining operations

    SPONSORED

    Trade Bitcoin with up to 100x leverage and maximize your profit potential

    Trade Now on Defx

    Market Sentiment Analysis

    Despite external pressures from the ‘TACO’ phenomenon affecting global markets, Bitcoin has maintained stability around $105K. Bitfinex analysts emphasize the market’s structural strength, viewing the current correction as a healthy reset rather than a bearish signal.

    FAQ Section

    Is Bitcoin still bullish after the recent correction?

    Yes, technical indicators and fundamental factors suggest Bitcoin remains in a strong uptrend despite the recent 6% correction from all-time highs.

    How does the Nigerian mining initiative impact Bitcoin?

    The Green Flare project helps address environmental concerns around Bitcoin mining while potentially adding significant hash power to the network through sustainable means.

    What are the key support levels to watch?

    Current major support levels exist at $105K and $100K, with resistance at the recent ATH of $112K.

    As always, investors should conduct thorough research and consider their risk tolerance before making investment decisions. This article does not constitute financial advice.

  • Ethereum Price Shows Historic Bull Setup as Whales Accumulate

    Ethereum Price Shows Historic Bull Setup as Whales Accumulate

    Ethereum (ETH) is displaying a rare confluence of bullish technical signals not seen since the 2020 bull market, as the second-largest cryptocurrency trades near $2,600 amid growing institutional interest.

    Technical analyst Kevin (@Kev_Capital_TA) has identified a series of historical indicators suggesting Ethereum could be on the verge of a major breakout. This analysis comes as exchange supply data shows ETH holdings reaching 7-year lows, potentially setting up for a supply squeeze.

    Multiple Technical Indicators Flash Green

    The monthly ETH/USD chart reveals a compelling setup featuring:

    • A “massive demand candle” in April after touching $1,400
    • 41% price surge in May breaking above the long-term super-trend
    • Monthly stochastic RSI preparing for a “V-shaped cross” out of oversold territory
    • MACD histogram showing 4-year compression pattern

    This technical confluence aligns with recent institutional developments, as multiple analysts project a potential rally to $8,000 based on improving fundamentals.

    SPONSORED

    Trade Ethereum with up to 100x leverage on perpetual contracts

    Trade Now on Defx

    Whale Accumulation Signals

    On-chain metrics reveal significant whale activity:

    • Money flow readings at historical lows but showing reversal
    • First green print on ETH dominance in over a year
    • Market Cipher buy signal triggered
    • VWAP crossing above zero line

    ETH/BTC Ratio Shows Promise

    The ETH/BTC pair is displaying several positive signals:

    • Testing 0.5 Fibonacci retracement level
    • Monthly stochastic RSI preparing to cross up after 1,066 days below 20
    • Demand candles forming similar to 2019-2020 accumulation phase

    Key Resistance Levels

    While the outlook appears bullish, ETH faces notable resistance at:

    • $2,800-3,000 zone (immediate resistance)
    • Previous rally peaks need to be overcome
    • Monthly timeframe suggests gradual progression rather than immediate breakout

    At press time, ETH trades at $2,607, maintaining its six-week uptrend despite minor pullbacks.