Tag: technical analysis

  • Bitcoin Price Golden Cross Signals $115K Target Despite Recent Dip

    Bitcoin Price Golden Cross Signals $115K Target Despite Recent Dip

    Bitcoin’s recent price action has caught the attention of traders and analysts alike, with renowned crypto analyst Doctor Profit highlighting a crucial technical formation that could signal further upside ahead. Recent analysis suggesting a $130K Bitcoin price target by September adds weight to the bullish outlook, despite the current market volatility.

    Golden Cross Formation Suggests Continued Bullish Momentum

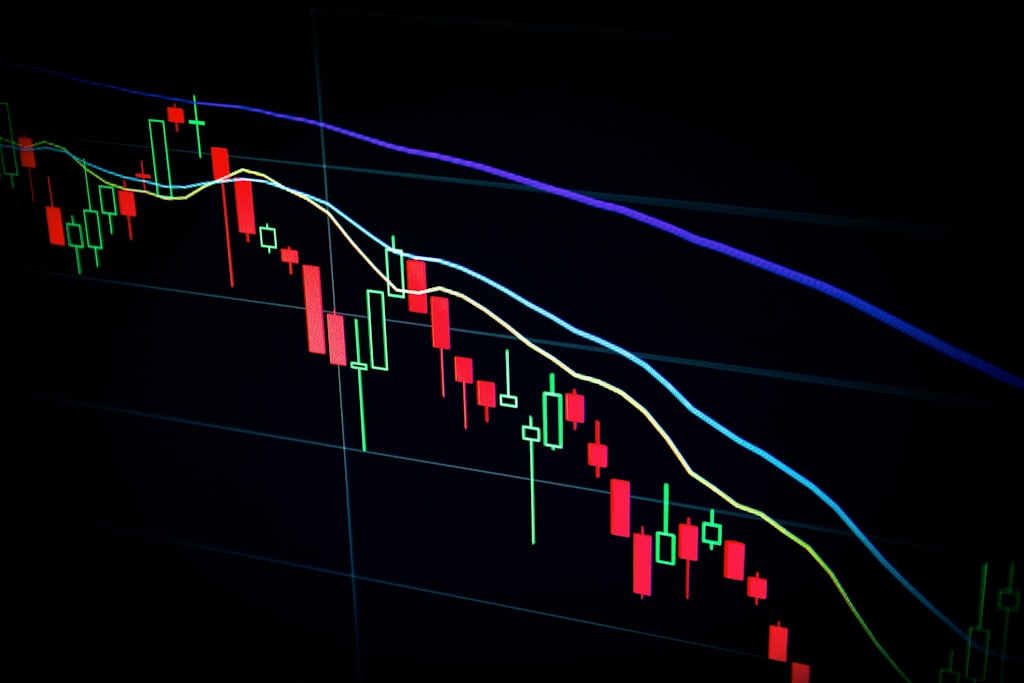
    The appearance of a Golden Cross on Bitcoin’s weekly chart has emerged as a significant technical indicator, with historical data showing this pattern’s remarkable accuracy in predicting sustained bull runs. Doctor Profit, known for his precise market calls, emphasizes that this rare technical formation has maintained a perfect track record of predicting multi-month rallies.

    SPONSORED

    Trade Bitcoin with up to 100x leverage and maximize your profit potential

    Trade Now on Defx

    Technical Analysis Breakdown

    Key technical indicators supporting the bullish thesis include:

    • Weekly Golden Cross formation
    • Cup and Handle pattern targeting $113,000-$115,000
    • Higher highs and higher lows since $74,000 bottom
    • Price trading above all major moving averages
    • Bullish MACD crossover on the weekly timeframe

    Market Structure Remains Strong Despite Bearish Divergence

    While some traders have expressed concern over a bearish divergence on the weekly timeframe, Doctor Profit dismisses these worries, citing a similar pattern that appeared at $80,000 without impacting the broader uptrend. Recent data showing whale accumulation of 78,000 BTC further supports the bullish narrative.

    Institutional Factors Supporting Bitcoin’s Uptrend

    Several institutional developments continue to support Bitcoin’s positive outlook:

    • Low BlackRock ETF outflows despite market turbulence
    • Strong institutional holding patterns
    • Long-term holder accumulation continuing

    FAQ Section

    What is a Golden Cross in Bitcoin trading?

    A Golden Cross occurs when a shorter-term moving average crosses above a longer-term moving average, typically signaling a bullish trend change.

    Why is the $115,000 level significant?

    This level represents the upper boundary of the Cup and Handle pattern formation, which typically serves as a strong breakout target.

    What could invalidate this bullish scenario?

    A break below the recent low of $74,000 would invalidate the current bullish structure and potentially signal a trend reversal.

    As Bitcoin continues to navigate through these critical price levels, maintaining position above key moving averages while forming bullish technical patterns suggests the potential for continued upside. Traders should remain vigilant of key support and resistance levels while managing risk appropriately.
  • Bitcoin Price Eyes $110K: Gold Pattern Signals Major Breakout Ahead

    Bitcoin’s correlation with gold has taken center stage as prominent analyst Charles Edwards identifies a critical price level that could trigger an explosive move upward. The cryptocurrency, currently trading at $104,200, shows remarkable similarities to gold’s historical price action, suggesting a potential surge if it closes above $110,000.

    Bitcoin-Gold Correlation Reveals Bullish Setup

    In a detailed analysis shared by Capriole Investments founder Charles Edwards, Bitcoin’s price movement has been closely mirroring gold’s historical pattern, particularly around all-time high (ATH) levels. This correlation gains significance as Bitcoin whales continue accumulating despite recent price highs, indicating strong institutional confidence in the asset.

    The analysis reveals that BTC’s consolidation at its 2021 ATH mirrors gold’s behavior around its 1980 peak, with one key difference – Bitcoin’s volatility is approximately double that of gold. This heightened volatility could amplify potential gains if the pattern continues to hold.

    SPONSORED

    Maximize your gains with up to 100x leverage on perpetual contracts

    Trade Now on Defx

    Market Distribution Analysis

    Recent data from Sentora provides crucial insights into Bitcoin’s current market structure:

    • Individual investors: 69.4% of total supply
    • ETFs and funds: 6.1%
    • Business holdings: 4.4%
    • Lost or forgotten coins: 7.5%

    This distribution data becomes particularly relevant as analysts project a $130,000 Bitcoin price target by September, driven by increasing M2 liquidity.

    Technical Analysis and Price Targets

    Edwards emphasizes that a close above $110,000 could trigger a significant price surge, similar to gold’s historical pattern. The cryptocurrency’s recent 4% weekly decline to $104,200 presents a potential accumulation opportunity before the projected breakout.

    FAQ Section

    What is the significance of the $110,000 level for Bitcoin?

    This price point represents a critical threshold that, if broken, could trigger a substantial rally based on historical gold price patterns and current market dynamics.

    How does Bitcoin’s volatility compare to gold?

    Bitcoin exhibits approximately twice the volatility of gold, suggesting potential for larger percentage moves in both directions.

    What percentage of Bitcoin is held by institutional investors?

    Currently, ETFs and funds control approximately 6.1% of the total Bitcoin supply, with potential for growth as institutional adoption increases.

  • Monero (XMR) Surges 11.5% to $366 – Key $420 Resistance in Focus

    Privacy-focused cryptocurrency Monero (XMR) has demonstrated remarkable strength amid broader market uncertainty, posting an 11.5% gain and reclaiming crucial support at $360. This price action comes as analysts eye a potential retest of the historical $420 resistance level, suggesting possible further upside.

    In a move that parallels recent market dynamics highlighted in Bitcoin’s recent ATH at $111K, Monero’s surge appears to be driven by fundamental strength rather than mere market speculation.

    Technical Analysis Shows Critical Support Levels

    XMR’s price action has been particularly noteworthy, with the token recording a 66% increase over the past six weeks. The cryptocurrency has maintained strong momentum despite a recent market-wide pullback, suggesting robust buyer interest at current levels.

    SPONSORED

    Trade Monero with up to 100x leverage on perpetual contracts

    Trade Now on Defx

    Key Price Levels to Watch

    • Current Support: $360
    • Critical Resistance: $420
    • Secondary Support: $310-$345
    • Historical Support: $286

    Expert Analysis and Predictions

    According to Rekt Capital, a prominent crypto analyst, XMR’s current price action mirrors its early 2021 pattern, suggesting potential for continued upward momentum. The analyst emphasizes the importance of maintaining support above $300 for sustained bullish momentum.

    FAQ Section

    What is driving Monero’s current price surge?

    The recent surge appears to be driven by a combination of technical breakouts and increased privacy-focused trading activity.

    What are the key resistance levels for XMR?

    The primary resistance level sits at $420, with secondary resistance at $370.

    Is Monero’s current rally sustainable?

    Technical indicators suggest strong support at current levels, though historical patterns indicate potential resistance at $420.

    As of this writing, Monero trades at $366, representing a 32.2% monthly increase. Traders should maintain careful position management given the historical volatility at key resistance levels.

  • Bitcoin Taker Buy/Sell Ratio Shows Bearish Divergence on Binance

    A concerning divergence has emerged in Bitcoin’s market dynamics, with Binance’s Taker Buy/Sell Ratio showing bearish signals despite broader market optimism. This analysis explores what this divergence means for BTC’s price trajectory and potential market implications.

    Key Findings: Binance’s Bearish Signal vs Market Optimism

    Recent data analysis reveals a significant divergence between Binance’s trading patterns and other major exchanges. While most platforms show bullish momentum, Binance – which handles approximately 60% of global BTC spot volume – displays notably bearish indicators. This divergence has historically preceded price corrections, as evidenced by similar patterns in August 2023 and February 2024.

    As noted in our recent analysis Bitcoin Warning Signs Mount as Long-Term Holders Exit $100K Level, multiple indicators suggest increasing caution in the market.

    Understanding the Taker Buy/Sell Ratio

    The Taker Buy/Sell Ratio serves as a crucial market sentiment indicator:

    • Ratio > 1.0: Indicates bullish sentiment (more buyers than sellers)
    • Ratio < 1.0: Suggests bearish sentiment (more sellers than buyers)
    • Current Binance ratio: Below 1.0 (bearish territory)

    SPONSORED

    Trade Bitcoin with up to 100x leverage and maximize your profit potential

    Trade Now on Defx

    Historical Context and Market Implications

    Previous instances of this divergence pattern have led to significant market movements:

    • August 2023: 5-10% price drop within days
    • February 2024: Similar correction pattern
    • Current situation: BTC price down 5% to $104,300

    Expert Analysis and Market Outlook

    Market analysts emphasize Binance’s crucial role in price discovery. With its dominant market position, bearish signals on Binance often override positive indicators from other exchanges. This suggests potential near-term volatility and possible price corrections.

    Frequently Asked Questions

    What does the Taker Buy/Sell Ratio indicate?

    This metric compares buying and selling pressure on exchanges, with values above 1.0 indicating bullish sentiment and below 1.0 suggesting bearish momentum.

    Why is Binance’s divergence significant?

    Binance handles approximately 60% of global BTC spot volume, making its trading patterns highly influential for overall market direction.

    What are the potential price implications?

    Historical patterns suggest a potential 5-10% price correction when similar divergences occur.

    Conclusion and Action Points

    While the broader market maintains bullish sentiment, Binance’s diverging indicators warrant caution. Traders should monitor this divergence closely and consider adjusting their positions accordingly. The next few days will be crucial in determining whether this pattern results in a significant market correction or normalizes with the broader market trend.

  • Solana Price Shows Bullish TD Signal Despite 13% Drop – Key Levels

    Solana Price Shows Bullish TD Signal Despite 13% Drop – Key Levels

    Solana (SOL) has entered a critical technical phase, with a key indicator suggesting a potential trend reversal despite recent bearish price action. The cryptocurrency, which has seen a 13% decline over the past week, is now showing signs of a possible recovery according to respected technical analysis patterns.

    TD Sequential Signals Potential SOL Price Reversal

    Crypto analyst Ali Martinez has identified a significant technical development on Solana’s 12-hour chart. The Tom DeMark (TD) Sequential indicator, a widely-respected technical analysis tool, has just flashed a buy signal after completing a sequence of nine red candles.

    This technical formation is particularly noteworthy as it comes after Solana’s recent DeFi developments and could signal a shift in market sentiment.

    Understanding the TD Sequential Pattern

    The TD Sequential operates through two distinct phases:

    • Setup Phase: Counts nine consecutive candles of the same color
    • Countdown Phase: Extends to thirteen candles for confirmation

    In Solana’s case, the completion of nine red candles typically suggests an exhaustion of selling pressure and a potential buying opportunity.

    SPONSORED

    Trade Solana with up to 100x leverage on perpetual contracts

    Trade Now on Defx

    Whale Activity Adds Market Uncertainty

    However, on-chain data presents a potentially conflicting narrative. A significant SOL whale has transferred 2.86 million tokens (valued at $441 million) to Binance, raising concerns about potential selling pressure. This massive transfer represents one of the largest single-wallet movements in recent weeks.

    Key Price Levels to Watch

    Current critical levels for Solana:

    • Current Price: $153.90
    • Immediate Resistance: $165.00
    • Key Support: $150.00

    FAQ Section

    What does the TD Sequential buy signal mean for Solana?

    The TD Sequential buy signal suggests a potential trend reversal after nine consecutive red candles, indicating possible price recovery ahead.

    How significant is the whale transfer to Binance?

    The $441 million transfer represents a substantial position that could impact market dynamics if the whale decides to sell.

    What are the key price levels traders should monitor?

    Traders should watch the $150 support level and $165 resistance level for potential breakout or breakdown scenarios.

    As the market digests these mixed signals, traders should maintain careful position sizing and implement proper risk management strategies. The confluence of technical indicators and whale movements suggests increased volatility may lie ahead for Solana.

  • XRP Price Trigger Point at $2.56 Could Launch 50% Rally, Wave Analysis Shows

    XRP appears poised for a significant breakout according to comprehensive technical analysis combining Elliott Wave Theory and Wyckoff principles. After months of consolidation, analysts have identified $2.56 as the critical trigger level that could ignite XRP’s next major rally phase.

    Technical Analysis Points to Major XRP Price Breakout

    A detailed wave count analysis by crypto analyst ‘Charting Prodigy’ reveals that XRP has completed Wave 1 of a new impulse cycle following April’s lows, with a subsequent WXY corrective Wave 2 pattern now resolved. The analysis suggests XRP is entering sub-wave 3 of Macro Wave 5 – typically the strongest wave in Elliott Wave sequences.

    This analysis aligns with recent technical indicators showing XRP approaching key resistance levels that could trigger accelerated price movement.

    SPONSORED

    Trade XRP with up to 100x leverage on perpetual contracts

    Trade Now on Defx

    Multiple Technical Indicators Support Bullish Outlook

    The confluence of technical signals supporting this potential breakout includes:

    • Wyckoff reaccumulation pattern completion
    • Bullish MACD divergence formation
    • Fibonacci extension targets aligned with $2.90-$3.40 range
    • Classic accumulation phases including PSY, AR, and ST identified

    Double-Digit Price Targets Emerge

    Adding weight to the bullish case, analyst Egrag Crypto’s analysis of the 2-week chart projects potential targets at $10, $18, $27, and even $55 in the coming months. This forecast is based on XRP’s historical performance within a macro ascending channel dating back to 2016.

    Key Support and Resistance Levels

    Level Significance
    $2.56 Primary trigger point
    $2.65 Secondary confirmation level
    $2.90-$3.40 Initial target range

    Frequently Asked Questions

    What is the key price level to watch for XRP?

    The critical trigger point is $2.56, with confirmation above $2.65 potentially signaling the start of a major rally phase.

    What technical indicators support the bullish outlook?

    Multiple indicators including Elliott Wave patterns, Wyckoff accumulation, MACD divergence, and Fibonacci extensions all align to support the bullish case.

    What are the potential price targets if XRP breaks out?

    Initial targets range from $2.90-$3.40, with longer-term projections suggesting possible moves to $10, $18, $27, and $55 based on macro chart patterns.

  • Bitcoin Price Drops 7% as Binance Sell Pressure Mounts – Key Levels to Watch

    Bitcoin Price Drops 7% as Binance Sell Pressure Mounts – Key Levels to Watch

    Bitcoin (BTC) has entered a notable correction phase, retreating 7% from its recent all-time high of $111,000 to current levels around $104,115. This price action comes as Bitcoin continues to trade sideways near the $105K level, with mounting sell pressure from Binance’s institutional traders signaling potential near-term volatility.

    Binance Trading Metrics Signal Bearish Sentiment

    According to recent analysis from CryptoQuant, Binance’s Taker Buy/Sell ratio has declined below the crucial 1.0 threshold, currently sitting at 0.98. This represents a significant 12% weekly decline and a concerning 25% monthly drop. As Binance commands roughly 60% of global Bitcoin spot trading volume, this metric carries substantial weight for overall market direction.

    SPONSORED

    Trade Bitcoin with up to 100x leverage and maximize your profit potential

    Trade Now on Defx

    Historical Context and Market Implications

    The current market dynamics mirror previous corrections from February 2024 and August 2023, where similar divergences in Binance’s trading patterns preceded Bitcoin price drops of 5-10%. This historical correlation suggests increased probability of continued downward pressure in the immediate term.

    Key Support Levels and Technical Outlook

    While the broader market shows some buying interest, with aggregate Taker Buy/Sell ratios reaching 1.35 across other exchanges, Binance’s dominant position means its bearish stance could overshadow these positive signals. Despite recent whale accumulation of 78,000 BTC, short-term technical indicators suggest increased volatility ahead.

    Expert Analysis and Price Targets

    CryptoQuant’s analysis warns of a potential bull trap unless Binance’s Taker Buy/Sell ratio can decisively break above 1.05. The current market structure suggests traders should prepare for heightened volatility and possible further downside as market sentiment aligns with institutional flows.

    FAQ Section

    What is the Taker Buy/Sell ratio?

    The Taker Buy/Sell ratio measures the relationship between buy and sell orders executed at market price. A ratio below 1.0 indicates more selling than buying pressure.

    Why is Binance’s trading activity significant?

    Binance accounts for approximately 60% of global Bitcoin spot trading volume, making its trading patterns a crucial indicator of market direction.

    What are the key support levels to watch?

    Current technical analysis suggests strong support at $100,000, with secondary support at $98,500 and $95,000 levels.

  • Bitcoin Exchange Reserves Drop 668K BTC: Supply Squeeze Incoming?

    Bitcoin’s market dynamics are shifting dramatically as exchange reserves plummet by 668,000 BTC since November 2024, potentially signaling an impending supply squeeze. This significant reduction in available Bitcoin on exchanges comes as whale accumulation continues despite BTC’s recent all-time high of $112,000.

    Exchange Reserves Hit Critical Levels

    According to data from CryptoQuant, centralized exchanges now hold approximately 2.43 million BTC, representing a substantial decline in selling pressure. At current market prices near $104,000, this remaining supply represents over $253 billion in potential liquidity.

    Bitcoin Exchange Reserve Metrics:

    • Total BTC Withdrawn: 668,000
    • Current Exchange Balance: 2,432,989 BTC
    • Withdrawal Period: Since November 2024
    • Market Value of Remaining Supply: $253.4 billion

    Technical Analysis and Price Outlook

    Bitcoin currently tests critical support at $103,600, with key technical levels suggesting potential downside risk. The 4-hour chart shows immediate resistance at the 34-EMA ($105,720), coinciding with the 50 and 100 SMA cluster.

    SPONSORED

    Trade Bitcoin with up to 100x leverage on perpetual contracts

    Trade Now on Defx

    Market Implications and Future Outlook

    The dramatic reduction in exchange reserves could signal an approaching supply squeeze, particularly if institutional demand continues to grow. However, market participants should note that significant resistance remains at $112,000.

    FAQ Section

    What does decreasing exchange reserves mean for Bitcoin?

    Decreasing exchange reserves typically indicate reduced selling pressure and increased hodling behavior, often considered bullish for long-term price action.

    Could this trigger another bull run?

    While reduced supply on exchanges is generally bullish, multiple factors including macro conditions and technical resistance levels will influence Bitcoin’s next major move.

    What are the key price levels to watch?

    Critical support lies at $103,600, while major resistance remains at $112,000. The $106,000 level serves as immediate resistance for potential recovery.

  • Ethereum Exchange Supply Hits 7-Year Low: Breakout Imminent?

    Ethereum’s exchange supply has plummeted to levels not seen since 2018, potentially signaling an imminent price breakout as on-chain metrics flash increasingly bullish signals. Data from Glassnode reveals that ETH held on centralized exchanges has reached a 7-year low, suggesting strong accumulation by long-term holders.

    The second-largest cryptocurrency has demonstrated remarkable strength in 2025, rallying over 100% from cycle lows near $1,600 to test resistance at $2,700. This price action has positioned ETH as a market leader, with many analysts suggesting this could be the catalyst for a broader altseason. Recent analysis indicates Ethereum could target $10,000 if current support levels hold.

    Exchange Supply Drain Points to Accumulation Phase

    The dramatic reduction in exchange-held ETH represents a significant shift in market dynamics. When investors move assets off exchanges into self-custody solutions, it typically indicates a strong conviction in future price appreciation. This behavior often precedes major market moves, as reduced liquid supply can amplify price movements when demand increases.

    SPONSORED

    Trade Ethereum with up to 100x leverage on perpetual contracts

    Trade Now on Defx

    Technical Analysis Points to Critical Support

    ETH currently trades at $2,484, consolidating above crucial support at $2,450. The 4-hour chart shows a series of higher lows, suggesting bulls are defending key levels despite recent market volatility. A breakout above $2,700 could trigger significant buying pressure, especially given the limited supply available on exchanges.

    FAQs About Ethereum’s Exchange Supply

    Q: Why is low exchange supply bullish?
    A: Reduced exchange supply typically indicates less selling pressure and stronger holder conviction, often preceding price increases.

    Q: What could trigger an ETH breakout?
    A: A combination of low supply, increased institutional interest, and technical breakout above $2,700 could catalyze a major move higher.

    Q: How does this compare to previous cycles?
    A: The current exchange supply level matches 2018 lows, which preceded Ethereum’s rally to all-time highs in the following cycle.

    Outlook and Key Levels to Watch

    While short-term price action remains choppy, the confluence of reduced exchange supply and strong technical support suggests Ethereum could be preparing for its next major move. Traders should watch the $2,700 resistance level, as a breakthrough could trigger accelerated buying pressure in an environment of limited available supply.

  • Dogecoin Price Dips Below $0.20: Key Support at $0.187 Could Trigger Rally

    Dogecoin Price Dips Below $0.20: Key Support at $0.187 Could Trigger Rally

    Dogecoin (DOGE) has fallen below the psychological $0.20 level amid broader crypto market weakness, presenting a potential buying opportunity for investors eyeing the popular meme coin. However, leading analysts suggest waiting for specific price action signals before accumulating positions.

    Strategic Entry Points for DOGE Buyers

    Crypto analyst DecyX has outlined a precise entry strategy, recommending investors wait for DOGE to test liquidity below $0.187 before initiating positions. This analysis aligns with our recent coverage in Dogecoin Price Alert: Critical $0.187 Support Could Trigger 15% Drop, which highlighted this crucial support level.

    SPONSORED

    Trade Dogecoin with up to 100x leverage on perpetual contracts

    Trade Now on Defx

    Technical Analysis Points to Potential Reversal

    Multiple technical indicators suggest DOGE could be approaching a significant bottom:

    • Double bottom formation on the 4-hour chart near $0.18
    • Hidden bullish divergence on the daily RSI
    • Symmetrical triangle breakout on the 1-hour timeframe
    • Fair Value Gap (FVG) remains untouched above current prices

    Price Targets and Risk Levels

    Analysts have identified key price levels for traders to watch:

    Level Significance
    $0.187 Critical support zone
    $0.213-0.215 Initial target range
    $0.235 Secondary resistance
    $0.2597 Long-term magnet level

    Bitcoin Correlation Remains Strong

    As Bitcoin recently pulled back from its all-time high, DOGE has shown strong correlation with the flagship cryptocurrency. Bitcoin’s recent break below $104K has contributed to downward pressure on altcoins, including Dogecoin.

    Frequently Asked Questions

    What is causing Dogecoin’s current price dip?

    The primary factors include Bitcoin’s correction from ATH, broader market sentiment, and technical resistance at the $0.20 level.

    When is the best time to buy Dogecoin?

    Analysts suggest waiting for confirmation of support at $0.187 and watching for bullish price action on lower timeframes before entering positions.

    What are the key resistance levels to watch?

    The immediate resistance lies at $0.20, followed by the $0.213-0.215 zone and $0.2597 as a longer-term target.

    Current Price Update: DOGE is trading at $0.1906 as of this writing, according to CoinMarketCap data.