Tag: technical analysis

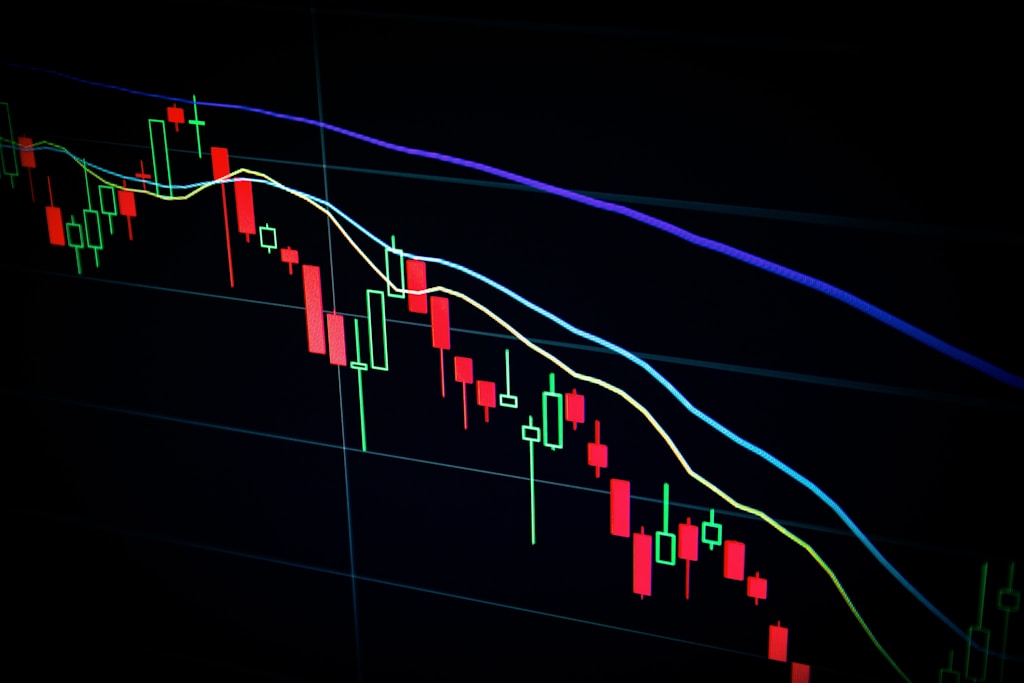
  • Bitcoin Trading: Elliott Wave Theory Reveals Key Pattern Signals

    Elliott Wave Theory is emerging as a powerful tool for Bitcoin traders seeking to navigate the cryptocurrency’s notorious volatility through structured market psychology analysis. As Bitcoin tests critical price levels near $106K, understanding these wave patterns becomes increasingly crucial for traders.

    Understanding Elliott Wave Theory in Crypto Markets

    Elliott Wave Theory posits that market movements follow predictable patterns driven by mass psychology. In the context of Bitcoin trading, these patterns manifest as five waves in the direction of the main trend, followed by three corrective waves.

    The Five-Wave Pattern in Bitcoin Markets

    • Wave 1: Initial move up (often triggered by early adopters)
    • Wave 2: First retracement (typically retraces 50-61.8% of Wave 1)
    • Wave 3: Strongest and longest wave (institutional interest peaks)
    • Wave 4: Another correction (usually shallower than Wave 2)
    • Wave 5: Final move up (retail FOMO phase)

    SPONSORED

    Trade Bitcoin with up to 100x leverage on perpetual contracts

    Trade Now on Defx

    Practical Application for Bitcoin Traders

    When applying Elliott Wave Theory to Bitcoin trading, consider these key factors:

    Wave Type Typical Characteristics Trading Strategy
    Impulse Waves Strong momentum, clear direction Hold positions, add on dips
    Corrective Waves Choppy price action, less volume Reduce exposure, wait for confirmation

    Combining Elliott Wave with Other Indicators

    For optimal results, traders should combine Elliott Wave analysis with:

    • Fibonacci retracement levels
    • Volume analysis
    • RSI and MACD indicators
    • Support and resistance levels

    Common Pitfalls to Avoid

    While powerful, Elliott Wave Theory requires careful application:

    • Don’t force wave counts into patterns
    • Always confirm with other technical indicators
    • Consider multiple timeframes
    • Account for Bitcoin’s unique market characteristics

    FAQ Section

    How accurate is Elliott Wave Theory for Bitcoin trading?

    Elliott Wave Theory shows approximately 70% accuracy when combined with other technical indicators and proper risk management.

    What timeframes work best for Elliott Wave analysis?

    Daily and 4-hour charts typically provide the most reliable wave patterns for Bitcoin trading.

    Can Elliott Wave predict Bitcoin price targets?

    While not exact, wave relationships can help project potential price targets using Fibonacci extensions.

    Remember: Always implement proper risk management strategies regardless of the analysis method used.
  • Solana Price Plunges Below $160: Key Support Levels for SOL Recovery

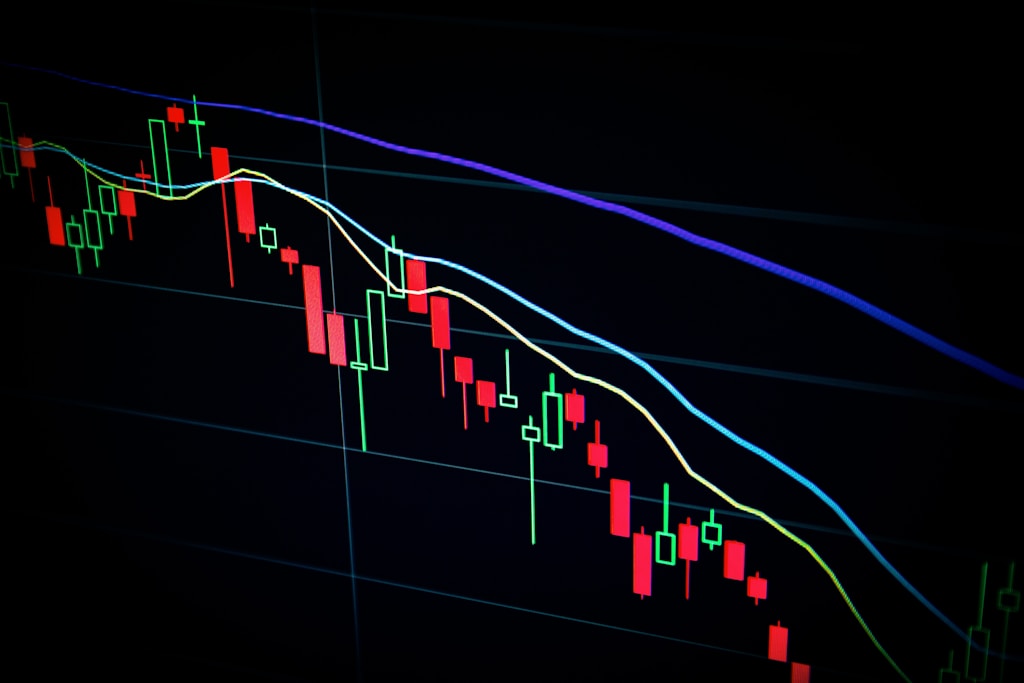
    Solana (SOL) continues its bearish momentum as the price drops sharply from the $172 resistance zone, leaving investors wondering about potential recovery scenarios. As the broader crypto market faces pressure, with Bitcoin testing critical support at $103K, SOL’s price action demands close attention.

    SOL Price Analysis: Technical Breakdown

    The recent price action shows SOL struggling to maintain momentum above key support levels:

    • Initial rejection at $172 resistance zone
    • Price trading below the crucial 100-hourly SMA
    • Formation of a bearish trend line at $160
    • Current support zone between $152-$155

    SPONSORED

    Trade SOL with up to 100x leverage on perpetual contracts

    Trade Now on Defx

    Critical Support and Resistance Levels

    For traders looking to capitalize on SOL’s next move, these key levels deserve attention:

    Resistance Levels:

    • Primary resistance: $160 (trend line)
    • Secondary resistance: $165 (50% Fib level)
    • Major resistance: $170-$172 zone

    Support Levels:

    • Immediate support: $155
    • Critical support: $152
    • Major support: $145
    • Last resort support: $132

    Technical Indicators Signal Bearish Momentum

    Current technical indicators paint a concerning picture for SOL:

    • MACD: Gaining momentum in bearish territory
    • RSI: Trading below 50, indicating bearish control
    • Moving Averages: Price below 100-hourly SMA

    Recovery Scenarios and Price Targets

    For SOL to initiate a recovery, these conditions must be met:

    1. Break above $160 resistance line
    2. Clear the $165 Fibonacci level
    3. Establish support above $170

    FAQ: Solana Price Action

    Q: What’s causing Solana’s current price decline?
    A: The decline appears technical in nature, following rejection at $172 and broader market pressure.

    Q: What’s the most important support level for SOL?
    A: The $152 level represents critical support, with $145 serving as the next major support zone.

    Q: Can SOL recover in the short term?
    A: Recovery depends on clearing the $160 resistance and maintaining momentum above this level.

    Conclusion: Watch These Levels

    While SOL faces immediate bearish pressure, the $152-$155 support zone remains crucial for preventing further decline. Traders should monitor the $160 resistance level for potential recovery signals, while maintaining stop losses below $145 for risk management.

  • XRP Price Tests $2.08 Support: Critical Level Could Prevent 15% Drop

    XRP Price Tests $2.08 Support: Critical Level Could Prevent 15% Drop

    XRP price is showing bearish signals as it tests a crucial support level at $2.08, with technical indicators suggesting potential for further downside movement. As previously reported, the $2.13 support level remains critical for any potential relief rally.

    Key Technical Levels for XRP

    The digital asset is currently facing several technical hurdles:

    • Immediate resistance at $2.220
    • Trading below the 100-hourly Simple Moving Average
    • Bearish trend line resistance at $2.2180
    • Critical support zone: $2.080-$2.120

    Market Structure Analysis

    The current price action shows a clear bearish pattern forming on the hourly chart. XRP has formed a series of lower highs and lower lows, with the most recent swing high at $2.3540 failing to maintain momentum. The 23.6% Fibonacci retracement level has been breached, suggesting increased selling pressure.

    SPONSORED

    Trade XRP with up to 100x leverage and maximize your profit potential

    Trade Now on Defx

    Support and Resistance Levels

    Key levels to watch:

    Type Level Significance
    Major Resistance $2.220 Previous support turned resistance
    Secondary Resistance $2.250 Weekly pivot point
    Critical Support $2.080 Must hold to prevent deeper correction

    Technical Indicators

    Multiple technical indicators are flashing warning signals:

    • MACD: Gaining bearish momentum
    • RSI: Below 50, indicating bearish control
    • Moving Averages: Price below 100-hour SMA

    Potential Scenarios

    Two primary scenarios are likely to unfold:

    1. Bearish Case: Break below $2.080 could trigger a cascade to $2.00
    2. Bullish Case: Recovery above $2.220 might target $2.3250

    FAQ

    What is the key support level for XRP?

    The critical support level is at $2.080, which must hold to prevent a deeper correction.

    Can XRP recover in the short term?

    A break above $2.220 resistance could trigger a recovery toward $2.3250.

    What technical indicators should traders watch?

    Focus on the MACD, RSI, and the 100-hour SMA for trading signals.

    Disclaimer: This article is not financial advice. Always conduct your own research and risk assessment before trading.

  • Ethereum Price Tests $2,470 Support: Key Levels for 15% Rally

    Ethereum Price Tests $2,470 Support: Key Levels for 15% Rally

    Ethereum (ETH) is showing signs of stabilization after a sharp decline from the $2,620 resistance level, with technical indicators suggesting potential for both further downside and a possible recovery. As recent analysis predicted consolidation patterns, ETH’s price action remains critical for determining the next major move.

    Key Ethereum Price Levels to Watch

    The second-largest cryptocurrency by market cap is currently testing several crucial support levels:

    • Current Price: $2,580
    • Critical Support: $2,470
    • Major Resistance: $2,600
    • 100-hour SMA: Below $2,600

    SPONSORED

    Trade ETH with up to 100x leverage and maximize your profit potential

    Trade Now on Defx

    Technical Analysis Deep Dive

    The current price action shows several key technical developments:

    • Bearish trend line breakout at $2,500
    • 23.6% Fibonacci retracement test from $2,787 high
    • RSI below 50, indicating bearish momentum
    • MACD gaining bearish momentum

    Potential Scenarios and Price Targets

    Scenario Target Probability
    Bullish Breakout $2,880 35%
    Bearish Continuation $2,350 45%
    Sideways Consolidation $2,470-$2,600 20%

    FAQ: Ethereum Price Action

    What’s causing the current Ethereum price decline?

    The decline appears technical in nature, following rejection at the $2,620 resistance level and broader market correlation with Bitcoin’s movement.

    When could ETH price recover?

    A sustained break above $2,600 could trigger a relief rally, potentially pushing prices toward the $2,880 target.

    What’s the worst-case scenario?

    If support at $2,470 fails, ETH could test lower supports at $2,420 and potentially $2,350.

    Conclusion and Market Outlook

    Ethereum’s price action remains critical at current levels. While the short-term outlook appears bearish, the formation of strong support at $2,470 could provide the foundation for a recovery. Traders should watch for a decisive break above $2,600 for confirmation of trend reversal.

  • Ethereum Price Signal Flashes 80% Rally Potential as Whales Accumulate

    Ethereum Price Signal Flashes 80% Rally Potential as Whales Accumulate

    Ethereum’s price trajectory is showing remarkable similarities to patterns that previously led to an 80% surge, with key on-chain metrics suggesting another potential monster rally ahead. Recent market volatility has set the stage for what could be a significant breakout.

    Key Ethereum Price Indicators Signal Bullish Momentum

    Currently trading at $2,537, Ethereum has been consolidating below the crucial $2,800 resistance level throughout May. Despite multiple attempts to breach this threshold, the second-largest cryptocurrency by market cap has faced persistent selling pressure. However, whale activity metrics suggest this consolidation phase could be nearing its end.

    SPONSORED

    Trade ETH with up to 100x leverage and maximize your profit potential

    Trade Now on Defx

    Whale Activity Analysis: A Deeper Look

    According to crypto analyst Darkfost, Ethereum’s Average Order Size on Binance has triggered a rare signal that previously preceded an 80% price surge. The last occurrence of this indicator in December 2023 was followed by ETH’s dramatic rise from $2,200 to $4,000.

    Technical Analysis and Price Targets

    The current setup shows striking similarities to the December 2023 pattern, with several key metrics aligning:

    • Average Order Size indicator showing increased whale activity
    • Strong accumulation patterns on Binance
    • Institutional investor positioning suggesting bullish sentiment

    Market Implications and Trading Opportunities

    With Ethereum’s price eyeing the $3,200 level, traders should watch for these critical price levels:

    • Immediate resistance: $2,800
    • Secondary resistance: $3,000
    • Primary support: $2,500
    • Secondary support: $2,300

    FAQ Section

    What triggered the previous 80% ETH rally?

    The December 2023 rally was triggered by similar whale accumulation patterns and institutional buying pressure.

    How reliable is the Average Order Size indicator?

    Historical data shows this indicator has accurately predicted major price movements with approximately 70% accuracy.

    What could prevent the predicted rally?

    Major market volatility, regulatory news, or broader crypto market corrections could impact the potential rally.

    Conclusion

    While past performance doesn’t guarantee future results, the confluence of whale activity metrics and technical indicators suggests Ethereum could be preparing for significant upside movement. Traders should maintain proper risk management while monitoring these developing signals.

  • Bitcoin Price Alert: $97K-$99K Support Zone Could Prevent Major Drop

    Bitcoin Price Alert: $97K-$99K Support Zone Could Prevent Major Drop

    Bitcoin’s price has entered a correction phase, dropping over 3% in the past week amid broader market pressure. The leading cryptocurrency currently trades above $104,000, marking a 7% decline from its recent all-time high of $111,970. As market participants closely monitor this retracement, renowned analyst Daan Crypto has identified a crucial support zone that could prevent further downside.

    This analysis comes at a critical time, as recent market analysis suggests Bitcoin must reclaim $106,000 to prevent a deeper correction.

    Technical Analysis Points to Strong Support Range

    According to Daan Crypto’s analysis shared on May 31, Bitcoin could find significant support between $97,000 and $99,000 if the current retracement continues. This prediction is backed by three powerful technical indicators:

    • Mid-range trading channel between $90,845 and $108,386
    • 200-day moving average convergence
    • 0.382 Fibonacci retracement level

    SPONSORED

    Trade Bitcoin with up to 100x leverage and maximize your profit potential

    Trade Now on Defx

    Market Implications and Risk Assessment

    The confluence of technical indicators at the $97,000-$99,000 range suggests strong buying pressure could emerge at these levels. However, a break below this zone could trigger a deeper correction toward $94,000.

    Current Market Status

    As of press time:

    • Current price: $104,650
    • 24-hour change: +0.14%
    • Monthly performance: +7.21%
    • Weekly decline: -2.86%

    Frequently Asked Questions

    What happens if Bitcoin breaks below $97,000?

    A break below the $97,000 support could trigger a deeper correction toward $94,000, potentially shifting market sentiment bearish.

    How significant is the 200-day moving average?

    The 200-day MA is a crucial long-term indicator that often acts as a strong support level during bull markets and typically signals trend direction.

    What makes the $97,000-$99,000 range significant?

    This range combines three technical indicators: mid-range support, 200-day MA, and the 0.382 Fibonacci level, making it a strong technical confluence zone.

  • Bitcoin Price Hits Historic ATH on Pizza Day: Key Metrics Signal Strong Rally

    Bitcoin Price Hits Historic ATH on Pizza Day: Key Metrics Signal Strong Rally

    Time to Read: 8 minutes

    Bitcoin achieved a significant milestone last week, reaching a new all-time high (ATH) during the celebrated Bitcoin Pizza Day. While the crypto community erupted in celebration, underlying market metrics suggest this rally has strong fundamentals supporting continued upward momentum.

    Bitcoin’s Historic Price Discovery Phase

    The timing of this new ATH carries particular significance, coinciding with Bitcoin Pizza Day – a day that commemorates the first real-world Bitcoin transaction. This symbolic alignment between Bitcoin’s past and its current price discovery phase highlights how far the cryptocurrency has come in terms of adoption and value appreciation.

    Key Market Metrics Supporting the Rally

    • Funding rates remain healthy and sustainable
    • On-chain data shows strong accumulation patterns
    • Institutional inflows continue to increase
    • Market sentiment indicators suggest room for growth

    SPONSORED

    Trade Bitcoin with up to 100x leverage and maximize your profit potential

    Trade Now on Defx

    Market Analysis and Future Outlook

    While euphoria is evident in the market, technical analysts suggest that Bitcoin needs to maintain momentum above key support levels to continue its upward trajectory. The current price action represents more than just speculative interest – it reflects growing institutional adoption and improving market fundamentals.

    FAQ Section

    Q: What caused Bitcoin’s new all-time high?
    A: A combination of strong institutional buying, positive market sentiment, and historical significance of Bitcoin Pizza Day contributed to the price surge.

    Q: Is this rally sustainable?
    A: Key metrics including funding rates, institutional inflows, and on-chain data suggest strong fundamental support for continued price discovery.

    Q: What are the next key resistance levels?
    A: Technical analysts are watching several critical price points for potential resistance, with major focus on psychological barriers.

  • XRP Whale Moves $97M from Turkish Exchange: Giga Pump Incoming?

    XRP Whale Moves $97M from Turkish Exchange: Giga Pump Incoming?

    In a significant development for XRP investors, a massive transfer of 44.1 million XRP tokens (approximately $97 million) has been executed from Turkish cryptocurrency exchange Paribu to an unknown wallet, potentially signaling an imminent price surge. This movement comes as XRP tests critical support levels, adding another layer of intrigue to the market dynamics.

    Massive XRP Transfer Details

    The transaction, which occurred on May 31, 2025, at 09:51 AM UTC, has caught the attention of crypto analysts and investors alike. The transfer was first identified by prominent XRP investor Xaif on social platform X, with blockchain data confirming the successful movement of tokens with a minimal transaction fee of 0.00001 XRP.

    SPONSORED

    Trade XRP with up to 100x leverage and maximize your profit potential

    Trade Now on Defx

    Market Implications and Technical Analysis

    The movement of such a substantial amount of XRP off an exchange typically indicates long-term holding intentions, which could reduce selling pressure in the market. Technical analyst Amonyx has identified a long-term symmetrical triangle breakout pattern on the monthly timeframe, suggesting a potential “giga pump” scenario.

    Price Targets and Fibonacci Extensions

    Based on Fibonacci extension analysis, key resistance levels have been identified at:

    • Primary target: $27.16 (1.618 Fib level)
    • Secondary target: $71.41 (1.902 Fib level)

    Current Market Status

    XRP is currently trading at $2.19, showing a 1.33% increase in the last 24 hours. The token’s price action suggests accumulation at current levels, potentially setting up for a larger move.

    FAQ Section

    What does this large XRP transfer mean for the market?

    Large transfers off exchanges typically indicate accumulation and reduced selling pressure, potentially leading to price appreciation.

    What are the key price levels to watch?

    The immediate support lies at $2.13, while major resistance levels are projected at $27.16 and $71.41 based on Fibonacci extensions.

    How does this movement compare to historical patterns?

    The current breakout pattern shows similarities to Bitcoin’s 2016 movement, suggesting potential for significant upside.

  • Bitcoin Price Target $340K: Key $91K Support Level Must Hold

    Bitcoin Price Target $340K: Key $91K Support Level Must Hold

    Bitcoin’s path to $340,000 hinges on a critical support level, according to prominent crypto analyst PlanD. Despite recent price retracement, technical analysis suggests BTC remains in a strong uptrend – but only if prices maintain above a key threshold. Recent analysis warning of a potential bearish reversal at $93K adds context to this developing situation.

    Cup and Handle Pattern Points to Massive Bitcoin Rally

    A massive 3-year cup and handle pattern has formed on Bitcoin’s chart, traditionally a highly bullish continuation signal. The pattern consists of:

    • Cup formation: BTC’s decline from $69K (Nov 2021) to March 2024 recovery
    • Handle: Descending channel from March-October 2024
    • Breakout: Decisive move above $76K neckline in November 2024

    Critical Support Zone: $91,000 – $100,000

    For the bullish thesis to remain valid, Bitcoin must defend the crucial support zone between $91,000 and $100,000. This aligns with recent analysis showing cautious optimism based on Bitcoin’s Sharpe ratio.

    SPONSORED

    Trade Bitcoin with up to 100x leverage on perpetual contracts

    Trade Now on Defx

    Current Market Status

    Bitcoin currently trades at $104,739, showing resilience with a 0.64% daily gain. Key levels to watch:

    • Current price: $104,739
    • 24h volume: $40.03B (↑31.28%)
    • Immediate resistance: $106,000
    • Secondary resistance: $109,000
    • All-time high: $111,970

    FAQ

    What could invalidate the $340K target?

    A sustained break below the $91,000 support level would significantly damage the bullish outlook.

    When could Bitcoin reach $340,000?

    According to PlanD’s analysis, this target could be achieved before 2025, assuming the support structure holds.

    What technical indicators support this prediction?

    The primary indicator is the cup and handle pattern, supported by current price action above key support levels.

  • Bitcoin Funding Rates Signal Healthy Market as BTC Tests $103K Support

    Bitcoin Funding Rates Signal Healthy Market as BTC Tests $103K Support

    Bitcoin’s recent 7% pullback from its all-time high of $112,000 has brought increased attention to derivatives market metrics, particularly funding rates, which are showing intriguing patterns that could signal the next major move. As Bitcoin tests critical support at $103K, the unusually low funding rates across major exchanges may actually be painting a bullish picture.

    Understanding Current Market Dynamics

    The cryptocurrency market is experiencing heightened uncertainty amid escalating US-China trade tensions and macroeconomic headwinds. Despite these challenges, Bitcoin’s technical structure remains remarkably resilient, with key support levels holding strong between $103,600 and $104,000.

    Funding Rates Analysis Reveals Market Health

    According to renowned analyst Darkfost, funding rates across major cryptocurrency exchanges are maintaining surprisingly low levels, even as Bitcoin trades near historic highs. This metric, which indicates the cost of holding leveraged positions in perpetual futures contracts, typically rises during euphoric market phases.

    SPONSORED

    Trade Bitcoin with up to 100x leverage on perpetual contracts

    Trade Now on Defx

    Technical Analysis and Support Levels

    The current price action shows Bitcoin testing crucial support between $103,600 and $104,000. The 34-day EMA at $102,710 provides additional technical confluence, suggesting strong buyer interest at these levels. Recent analysis indicates that Bitcoin must break above $106K to maintain its bullish momentum and prevent a deeper correction.

    Market Implications and Future Outlook

    The low funding rates environment, combined with significant short positions, creates potential for a strong upward move through short squeeze mechanics. This technical setup, alongside decreasing selling pressure, suggests Bitcoin may be preparing for its next leg up once market conditions stabilize.

    Frequently Asked Questions

    What do low funding rates indicate in crypto markets?

    Low funding rates typically indicate cautious market sentiment and reduced leverage, which can be healthy for sustainable price growth.

    Why is the $103K-$104K support zone significant?

    This zone represents a crucial technical level where multiple indicators converge, including the 34-day EMA and previous resistance turned support.

    What could trigger Bitcoin’s next upward move?

    A combination of short squeeze potential, low leverage, and strong technical support could catalyze the next bullish phase once global market conditions improve.