Tag: technical analysis

  • Bitcoin Liquidity Remains Strong at $86K Despite Capital Inflow Slowdown

    Bitcoin Liquidity Remains Strong at $86K Despite Capital Inflow Slowdown

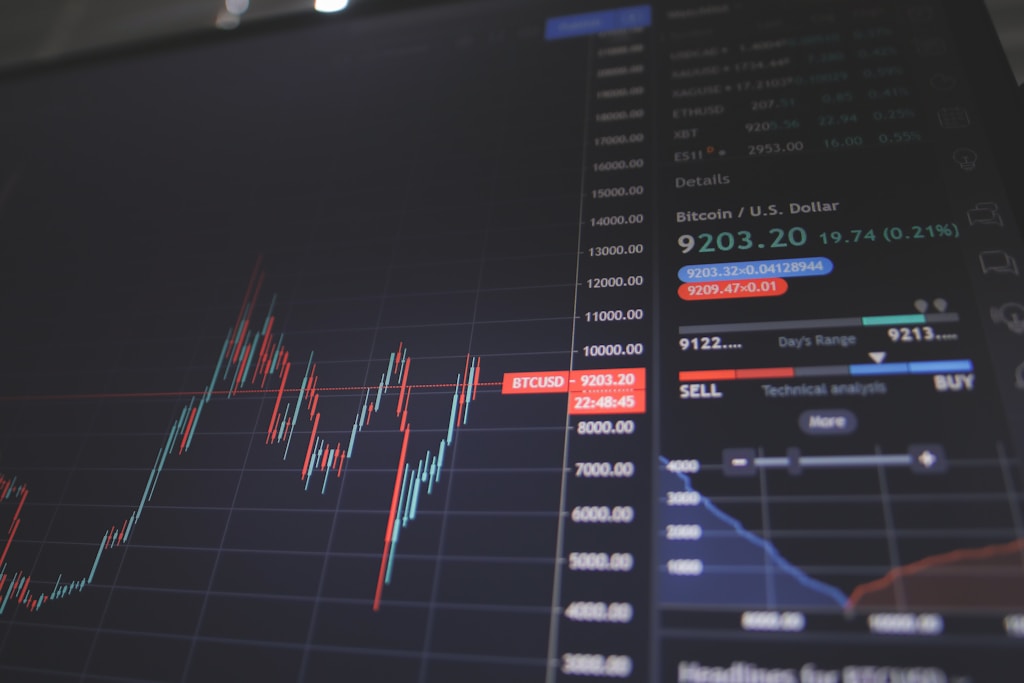
    Bitcoin’s resilience continues to impress market observers as the leading cryptocurrency maintains strength above $85,500, despite recent concerns about slowing capital inflows. With the crucial $90,000 level in sight, on-chain metrics reveal a more nuanced picture of market health than recent headlines suggest.

    Understanding Bitcoin’s Current Liquidity Dynamics

    Recent market commentary has focused on supposedly declining Bitcoin liquidity, but data from CryptoQuant presents a different narrative. Bitcoin’s Realized Capitalization continues its upward trajectory, growing at 0.6% monthly and reaching approximately $866 billion. This metric suggests the market is experiencing a natural cooling period rather than a concerning liquidity crunch.

    SPONSORED

    Trade Bitcoin with up to 100x leverage and maximize your profit potential

    Trade Now on Defx

    Technical Analysis: Key Price Levels to Watch

    Bitcoin currently trades at $88,200, with several critical technical levels in focus:

    • Immediate resistance: $90,000 (psychological level)
    • Key support: $84,000
    • 200-day moving average: Critical for trend confirmation
    • 200-day EMA: Secondary validation level

    Market Sentiment and Institutional Interest

    Despite slower capital inflows, institutional interest remains robust. GameStop’s recent $4.8B Bitcoin investment plan demonstrates growing corporate confidence in cryptocurrency as a treasury asset.

    FAQ: Bitcoin Liquidity Concerns

    Is Bitcoin liquidity really declining?

    No, on-chain data shows continued growth in Realized Capitalization, indicating healthy market depth despite slower inflow rates.

    What does reduced capital inflow mean for Bitcoin’s price?

    Slower inflows typically indicate market consolidation rather than weakness, often preceding new price discovery phases.

    How does current liquidity compare to previous cycles?

    Current metrics show stronger foundational liquidity than previous cycles, supported by broader institutional participation.

    Looking Ahead: Market Implications

    The current market structure suggests Bitcoin is in a consolidation phase rather than showing signs of weakness. While capital inflows have moderated, the underlying market health remains strong, supported by growing institutional adoption and improving market infrastructure.

  • Dogecoin Price Breaks $0.18: Key Technical Signals Point to Major Rally

    Dogecoin Price Breaks $0.18: Key Technical Signals Point to Major Rally

    Dogecoin (DOGE) has staged a remarkable comeback, breaking above the critical $0.18 resistance level amid surging trading volume and renewed investor interest. This price action comes as major institutional players enter the DOGE ecosystem, suggesting growing mainstream adoption of the popular meme coin.

    Technical Analysis Shows Bullish Momentum Building

    The recent price action demonstrates strong bullish momentum, with several key technical indicators aligning to support further upside potential:

    • RSI climbing above 50, indicating strengthening momentum
    • Increasing trading volume confirming buyer interest
    • $0.18 level flipping from resistance to support
    • Multiple technical indicators showing bullish convergence

    Key Price Targets and Resistance Levels

    With the breakthrough above $0.18, traders are now eyeing several important resistance levels:

    • First major resistance: $0.24
    • Secondary target: $0.29
    • Extended bullish scenario: $0.35-$0.40

    SPONSORED

    Trade DOGE with up to 100x leverage and maximize your profit potential

    Trade Now on Defx

    Downside Risks and Support Levels

    While the outlook appears bullish, traders should monitor key support levels:

    • Critical support: $0.18 (previous resistance turned support)
    • Secondary support: $0.12
    • Strong accumulation zone: $0.09

    Market Implications and Trading Strategy

    The current price action suggests a potential shift in market sentiment, with increased institutional interest supporting the bullish case. Traders should consider:

    • Setting stop losses below $0.18 to protect against potential reversals
    • Taking partial profits at key resistance levels
    • Monitoring volume for confirmation of trend strength

    Frequently Asked Questions

    What is driving Dogecoin’s current price movement?

    The recent surge is supported by increased trading volume, technical breakout above $0.18, and growing institutional interest in the cryptocurrency.

    What are the key levels to watch for Dogecoin?

    The critical support level is $0.18, while major resistance levels lie at $0.24, $0.29, and $0.35.

    Is this a good time to invest in Dogecoin?

    While technical indicators suggest bullish momentum, investors should conduct thorough research and consider their risk tolerance before making investment decisions.

  • XRP Price Alert: Peter Brandt Warns of 44% Drop to $1.07

    XRP Price Alert: Peter Brandt Warns of 44% Drop to $1.07

    Veteran trader Peter Brandt has issued a stark warning for XRP holders, identifying a potential 44% price drop to $1.07 based on classic technical analysis patterns. This bearish forecast comes just weeks after XRP tested the critical $2.50 resistance level, highlighting the asset’s increased volatility.

    Key Technical Indicators Point to Bearish Setup

    According to Brandt’s analysis, XRP is forming a textbook head and shoulders pattern, widely recognized as a bearish reversal signal in technical analysis. The pattern is currently developing as the price struggles to maintain support near the $1.90 level.

    Critical Price Levels to Watch:

    • Current Support: $1.90
    • Neckline Break Point: $1.75
    • Target Price: $1.07
    • Previous Support: $1.50

    Historical Context and Market Implications

    This bearish outlook comes at a crucial time for XRP, following its recent regulatory victories. The landmark SEC settlement that reduced Ripple’s fine to $50M had previously fueled optimistic price projections, making this technical warning particularly significant for investors.

    SPONSORED

    Trade XRP with up to 100x leverage on perpetual contracts

    Trade Now on Defx

    Expert Analysis and Risk Factors

    Peter Brandt’s track record in cryptocurrency technical analysis adds weight to this prediction. The veteran trader emphasizes that while the pattern is not yet confirmed, traders should prepare for increased volatility and potential downside risks.

    Trading Strategy Considerations

    For traders and investors monitoring XRP’s price action, several key strategies emerge:

    • Set stop-loss orders below $1.75 to protect against further downside
    • Watch for volume confirmation of any breakdown
    • Monitor RSI and MACD for additional confirmation signals
    • Consider reducing exposure if support levels fail

    Frequently Asked Questions

    Q: What could invalidate this bearish scenario?

    A: A decisive break above $2.20 with strong volume would likely invalidate the head and shoulders pattern.

    Q: How reliable are head and shoulders patterns in crypto markets?

    A: While traditionally reliable in traditional markets, crypto volatility can affect pattern reliability. Success rates typically range from 62% to 83% in crypto markets.

    Q: What timeframe is projected for this potential price drop?

    A: Technical patterns typically play out within 1-3 months, though crypto market conditions can accelerate or delay this timeline.

    Investors are advised to maintain strict risk management practices and consider multiple technical and fundamental factors before making trading decisions.

  • Bitcoin SuperTrend Shows 114-Week Buy Signal: $180K Target Ahead

    Bitcoin SuperTrend Shows 114-Week Buy Signal: $180K Target Ahead

    Bitcoin’s technical indicators are flashing strong bullish signals as the cryptocurrency maintains an unprecedented 114-week buy signal on the SuperTrend indicator. This development comes as Bitcoin recently broke through the $88,000 resistance level, setting up what could be a historic price movement.

    SuperTrend Analysis Reveals Extended Bull Run

    According to crypto analyst Tony Severino, Bitcoin has maintained an active buy signal on the SuperTrend weekly indicator for an impressive 114 weeks, approximately 800 days. This sustained bullish indicator suggests strong underlying momentum as BTC approaches the psychological $90,000 level.

    SPONSORED

    Trade Bitcoin with up to 100x leverage on perpetual contracts

    Trade Now on Defx

    Price Targets and Expert Predictions

    Several prominent analysts have provided ambitious price targets for Bitcoin:

    • PlanB: Projects a potential doubling of BTC price to $180,000
    • Standard Chartered: Maintains $200,000 price target for 2025
    • Titan of Crypto: Forecasts new ATH of $121,000 based on EMA analysis

    Risk Factors and Market Catalysts

    While the overall trend remains bullish, several factors could impact Bitcoin’s trajectory:

    • Trump’s reciprocal tariffs (April 2nd implementation)
    • Previous tariff-related selloff led to $77,000 support test
    • Potential SuperTrend sell signal could trigger decline to $22,000

    Institutional Activity and Whale Movements

    Supporting the bullish case, significant whale accumulation continues with over 22,000 BTC withdrawn from exchanges in the past week. This institutional activity aligns with other key metrics indicating strong market fundamentals.

    FAQ Section

    What is the SuperTrend indicator?

    The SuperTrend is a technical analysis tool that helps identify trend direction and potential reversal points by combining moving averages with volatility indicators.

    How significant is the 114-week buy signal?

    This represents one of the longest sustained buy signals in Bitcoin’s history, indicating exceptional strength in the current bull market.

    What could trigger a market reversal?

    Key risks include regulatory changes, macroeconomic factors like tariffs, and technical sell signals on the SuperTrend indicator.

    At time of writing, Bitcoin trades at $87,500, maintaining strong momentum despite recent market volatility.

  • Solana Price Hits Key Bollinger Band Level: First Time Since $270 ATH

    Solana (SOL) is showing promising technical signals as the cryptocurrency tags its upper Bollinger Band for the first time since reaching its all-time high of $270. This rare technical development comes as SOL maintains position above the crucial $135 support level, potentially signaling a shift in momentum.

    Top crypto analyst Big Cheds highlighted this significant technical milestone, noting that SOL’s interaction with the upper Bollinger Band could indicate building bullish pressure. However, traders remain cautious as the broader market continues to show signs of uncertainty. Recent institutional interest in Solana through Fidelity’s ETF filing adds another layer of significance to this technical development.

    SPONSORED

    Trade Solana with up to 100x leverage on perpetual contracts

    Trade Now on Defx

    Critical Price Levels and Technical Analysis

    Currently trading at $144, SOL faces immediate resistance at $150, with the more significant barrier zone between $170-180. The recent upper BB tag occurs as the asset attempts to recover from a 51% drawdown from January highs, suggesting potential trend reversal signals.

    Key Support and Resistance Zones

    • Current Support: $135
    • Immediate Resistance: $150
    • Major Resistance Zone: $170-180
    • Previous ATH: $270

    Market Sentiment and Outlook

    While the upper BB tag is traditionally a bullish signal, market participants remain divided on SOL’s next move. The broader crypto market’s uncertain conditions and previous false breakouts warrant careful position management.

    FAQ

    What does the upper Bollinger Band tag indicate?
    The upper BB tag often signals strong momentum and potential trend continuation, especially when accompanied by increasing volume.

    Can Solana reclaim its previous ATH?
    While possible, SOL needs to first establish support above $150 and clear the crucial $170-180 resistance zone before targeting higher levels.

    What are the key risk factors?
    Primary risks include broader market weakness, potential rejection at $150, and the possibility of a drop below $135 support.

  • XRP Price Alert: Technical Charts Signal Potential 15% Surge Ahead

    XRP Price Alert: Technical Charts Signal Potential 15% Surge Ahead

    XRP’s price action is showing promising signs of an imminent breakout, with multiple timeframe analysis suggesting a potential 15% surge from current levels. As XRP tests the critical $2.50 resistance level, traders are closely monitoring key technical indicators for confirmation of the next major move.

    Current Market Status

    As of March 26, 2025, XRP is trading at $2.45, maintaining a relatively stable position within a narrow range of $2.43 to $2.48. The digital asset’s market capitalization stands at $142 billion, supported by a healthy 24-hour trading volume of $2.40 billion.

    Technical Analysis Breakdown

    Multiple timeframe analysis reveals a compelling case for XRP’s potential upward movement:

    • 1-Hour Chart: Formation of an ascending channel with strong support at $2.44
    • 4-Hour Chart: Bullish convergence patterns emerging
    • Daily Chart: Key resistance levels identified at $2.50 and $2.65

    SPONSORED

    Trade XRP with up to 100x leverage and maximize your profit potential

    Trade Now on Defx

    Key Support and Resistance Levels

    Level Type Price Point Significance
    Support 1 $2.44 Immediate Support
    Support 2 $2.40 Secondary Support
    Resistance 1 $2.50 Major Resistance
    Resistance 2 $2.65 Target Zone

    Market Catalysts

    The potential surge comes amid increasing institutional interest in XRP, particularly following the recent launch of an XRP ETP on Nasdaq Stockholm. This development, combined with improving technical indicators, suggests a possible continuation of the broader uptrend.

    FAQ Section

    What is the immediate price target for XRP?

    The immediate price target sits at $2.50, with potential for extension to $2.65 if the breakout confirms.

    What are the key support levels to watch?

    Traders should monitor $2.44 as immediate support, with $2.40 serving as a stronger secondary support level.

    How does volume support the current setup?

    The current 24-hour trading volume of $2.40 billion indicates healthy market participation, supporting the potential for a sustained move.

    Time to Read: 4 minutes

  • Bitcoin Eyes $95K: Market Greed Hits Peak as Miners Hold Strong

    Bitcoin Eyes $95K: Market Greed Hits Peak as Miners Hold Strong

    Bitcoin’s meteoric rise to $88,500 has ignited fresh speculation about an imminent push to $95,000, though market indicators suggest caution may be warranted. Recent analysis of key resistance zones points to potential consolidation before the next major move.

    Market Sentiment: Greed Takes Center Stage

    According to Santiment’s latest market intelligence data, crypto investors are displaying increasing signs of greed, with social media mentions of Bitcoin reaching $100,000 or even $159,000 flooding platforms. This surge in optimistic sentiment comes after Bitcoin’s recovery from February lows of $78,000.

    However, as historical market metrics indicate, extreme greed often precedes significant price corrections. Traders should exercise caution as these sentiment peaks typically signal potential market adjustments.

    Mining Community Shows Confidence

    A particularly bullish signal comes from the mining sector, where CryptoQuant data reveals miners are holding onto their Bitcoin reserves, now totaling 1.81 million BTC (approximately $159 billion). This accumulation behavior suggests miners anticipate higher prices ahead.

    SPONSORED

    Trade Bitcoin with up to 100x leverage and maximize your profit potential

    Trade Now on Defx

    Institutional Momentum Builds

    The institutional landscape continues to strengthen, with U.S. Bitcoin spot ETFs recording significant inflows. BlackRock led the charge with $42 million in daily inflows, pushing their total net assets above $50 billion. Despite outflows from smaller players like Bitwise and WisdomTree, the overall trend remains positive.

    Technical Analysis Points to Consolidation

    Short-term technical indicators suggest Bitcoin might need to consolidate before attempting the push to $95,000. The formation of a double top pattern on the 4-hour chart indicates potential resistance, with support at $86,146 serving as a crucial level to watch.

    FAQ Section

    Q: What is causing Bitcoin’s current price surge?
    A: A combination of strong institutional demand, miner accumulation, and positive market sentiment are driving the current rally.

    Q: Could Bitcoin reach $95,000 in the near term?
    A: While technical indicators suggest potential for reaching $95,000, a period of consolidation may occur first, with key support at $86,146.

    Q: What are the main risks to consider?
    A: High levels of market greed, technical resistance patterns, and historical tendency for corrections after such rallies are the primary risk factors.

  • Bitcoin Price Eyes 14% Jump to $100K as Key $90K Level Nears

    Bitcoin Price Eyes 14% Jump to $100K as Key $90K Level Nears

    Bitcoin (BTC) has demonstrated remarkable resilience, climbing nearly 5% over the past week and setting its sights on a potential 14% surge to the coveted $100,000 level. The leading cryptocurrency’s recent price action suggests a significant breakout could be imminent as it approaches crucial resistance zones.

    Bitcoin’s Technical Setup Shows Bullish Momentum

    After successfully reclaiming the $84,000-$85,000 range that had previously acted as resistance, Bitcoin has established a solid foundation for further upward movement. The flagship cryptocurrency has maintained steady momentum, breaking above $88,000 and showing signs of strength at current levels.

    SPONSORED

    Maximize your trading potential with up to 100x leverage on perpetual contracts

    Trade Now on Defx

    Critical Price Levels to Watch

    According to analyst Alex Clary, Bitcoin’s technical indicators are aligning favorably, with the cryptocurrency showing:

    • RSI bullish divergence
    • V-shaped recovery pattern
    • Breakout above downtrend resistance
    • Strong support at $86,000

    Weekly Close Requirements for Continued Uptrend

    Rekt Capital’s analysis highlights two critical levels that Bitcoin needs to secure:

    • $88,400 (21-week EMA)
    • $93,500 (Re-Accumulation Range Low)

    Market Correlation and External Factors

    The cryptocurrency’s correlation with traditional markets, particularly the S&P 500, continues to play a significant role in its price action. This relationship suggests broader market sentiment remains a key driver for Bitcoin’s movements.

    FAQ Section

    Q: What is the next major resistance level for Bitcoin?
    A: The $90,000 level represents the next significant resistance, with $93,500 being a crucial technical target.

    Q: What could trigger the projected 14% price increase?
    A: A successful break and hold above $90,000, combined with positive technical indicators and market sentiment, could fuel the rally to $100,000.

    Q: What are the key support levels to monitor?
    A: The primary support zones are at $86,000 and $88,400, with the latter being particularly significant as it aligns with the 21-week EMA.

    Conclusion

    As Bitcoin approaches the critical $90,000 resistance level, the technical setup suggests a potential 14% surge to $100,000 is within reach. However, traders should remain vigilant of key support levels and market correlations that could influence this projected movement.

  • Bitcoin Price Holds $85K: 4 Key Metrics Signal Market Direction

    Bitcoin continues to demonstrate resilience at the $85,000 level, with on-chain metrics providing crucial insights into the market’s next potential move. As recent price action tests key resistance zones, analysts are closely monitoring four critical indicators that could determine Bitcoin’s short-term trajectory.

    Market Overview: Bitcoin’s Current Position

    Bitcoin is maintaining stability around $87,000, experiencing only a minor 0.4% decline over the past 24 hours. This relative strength comes after the cryptocurrency briefly touched $88,000 earlier in the week, suggesting continued buying pressure despite market uncertainties.

    SPONSORED

    Maximize your trading potential with up to 100x leverage on perpetual contracts

    Trade Now on Defx

    Four Critical On-Chain Metrics Analysis

    1. Internal Funding Pressure (IFP)

    The IFP metric currently sits at 696K, below its 90-day SMA of 794K. Historical data suggests that crossing above the SMA90 typically precedes significant bullish momentum. The current positioning indicates potential accumulation phases before the next upward move.

    2. Bull & Bear Market Cycle Indicator

    Current readings show the DMA30 at -0.16 versus the DMA365 at 0.18. This divergence mirrors previous cycle patterns where temporary bearish signals preceded strong recoveries.

    3. Market Value to Realized Value (MVRV)

    The MVRV score remains below its 365-day SMA, historically a precursor to increased market activity. While this might suggest near-term selling pressure, similar patterns during the August 2024 crisis resolved positively.

    4. Net Unrealized Profit/Loss (NUPL)

    With NUPL at 0.49 compared to its 0.53 moving average, the metric suggests room for growth while staying within healthy market parameters.

    Expert Analysis and Market Implications

    According to CryptoQuant analyst Burak Kesmeci, these metrics collectively indicate market turbulence but fall short of suggesting a cycle top. This analysis aligns with recent support level studies that point to strong fundamental backing at current prices.

    Looking Ahead: Market Scenarios

    While short-term uncertainty persists, the broader market structure remains intact. External factors, including recent economic developments and regulatory discussions, continue to influence price action. However, the technical framework suggests Bitcoin maintains the potential for continued upward momentum once current resistance levels are cleared.

    FAQ Section

    What do the current on-chain metrics suggest for Bitcoin’s price?

    The metrics indicate short-term turbulence but don’t suggest a market top, pointing to potential continuation of the broader uptrend once current resistance levels are cleared.

    How does the current market structure compare to previous cycles?

    Current indicators show similarities to previous accumulation phases, particularly the patterns observed during the 2024 market recovery.

    What are the key resistance levels to watch?

    The immediate resistance lies at $88,000, with secondary resistance at the recent high of $89,000.

  • Cardano (ADA) Price Targets $0.80 as Bulls Defend Key Support Level

    Cardano (ADA) is showing strong bullish momentum as the cryptocurrency maintains crucial support above $0.720, with technical indicators suggesting potential for a significant upward move. The latest price action analysis reveals multiple bullish signals that could propel ADA towards the $0.80 mark.

    Key Technical Developments for Cardano

    In a notable development that mirrors the broader crypto market recovery, where Bitcoin recently surged past $85,000, Cardano has established a solid foundation above the $0.720 support level. The asset is currently trading above both the $0.720 mark and the 100-hourly simple moving average, indicating strong underlying momentum.

    Critical Price Levels to Watch

    • Current Support: $0.7380
    • Key Resistance: $0.7550
    • Major Target: $0.80
    • Secondary Target: $0.850

    Technical Analysis Breakdown

    The formation of a bullish trend line with support at $0.7385 on the hourly chart suggests strong buyer presence. This technical structure, combined with the asset’s position above key moving averages, provides a solid foundation for potential upward movement.

    SPONSORED

    Trade ADA with up to 100x leverage on perpetual contracts

    Trade Now on Defx

    Resistance and Support Analysis

    The immediate resistance levels are structured as follows:

    • First resistance: $0.7550
    • Second resistance: $0.7620
    • Major psychological resistance: $0.80

    Support levels are equally well-defined:

    • Primary support: $0.7380
    • Secondary support: $0.7200
    • Critical support: $0.690

    Market Indicators and Signals

    Current technical indicators present a mixed but predominantly bullish picture:

    • MACD: Showing decreased bullish momentum but remains in the positive zone
    • RSI: Currently below 50, indicating potential for renewed buying pressure
    • Moving Averages: Price maintaining position above 100-hourly SMA

    Potential Scenarios and Price Targets

    Two primary scenarios emerge from the current technical setup:

    Bullish Scenario

    A successful break above $0.7620 could trigger a rally toward $0.80, with potential extension to $0.850. This scenario is supported by the current trend line and price action pattern.

    Bearish Scenario

    Failure to maintain support at $0.7380 could lead to a retest of $0.720, with $0.690 serving as the final support before more significant downside risk.

    FAQ Section

    What is the key level Cardano needs to break for a bullish continuation?

    The critical resistance level is $0.7550, followed by $0.7620. Breaking these levels could confirm the bullish trend.

    What are the major support levels to watch?

    The primary support levels are $0.7380 and $0.7200, with $0.690 serving as a critical support zone.

    Could Cardano reach $0.80 in the near term?

    Technical analysis suggests $0.80 is a realistic target if current support holds and resistance levels are broken successfully.

    Conclusion

    Cardano’s current technical setup presents a cautiously optimistic outlook, with potential for significant upside if key resistance levels are cleared. Traders should monitor the $0.7550 and $0.7620 levels closely while maintaining awareness of critical support at $0.7380.