Tag: technical analysis

  • Dogecoin Price Alert: Analyst Predicts 174% Rally to $0.65 Target

    Dogecoin Price Alert: Analyst Predicts 174% Rally to $0.65 Target

    Dogecoin (DOGE) has entered a critical phase after experiencing a significant pullback from recent highs. As previously reported, the meme coin is testing crucial support levels that could determine its next major move.

    Price Action Shows Key Support Test

    DOGE has declined from $0.25 to approximately $0.21, marking a 10% weekly drop. Despite the short-term bearish price action, prominent analyst Javon Marks maintains an extremely bullish outlook, projecting a potential 174% surge to $0.65.

    Technical Analysis Reveals Bullish Setup

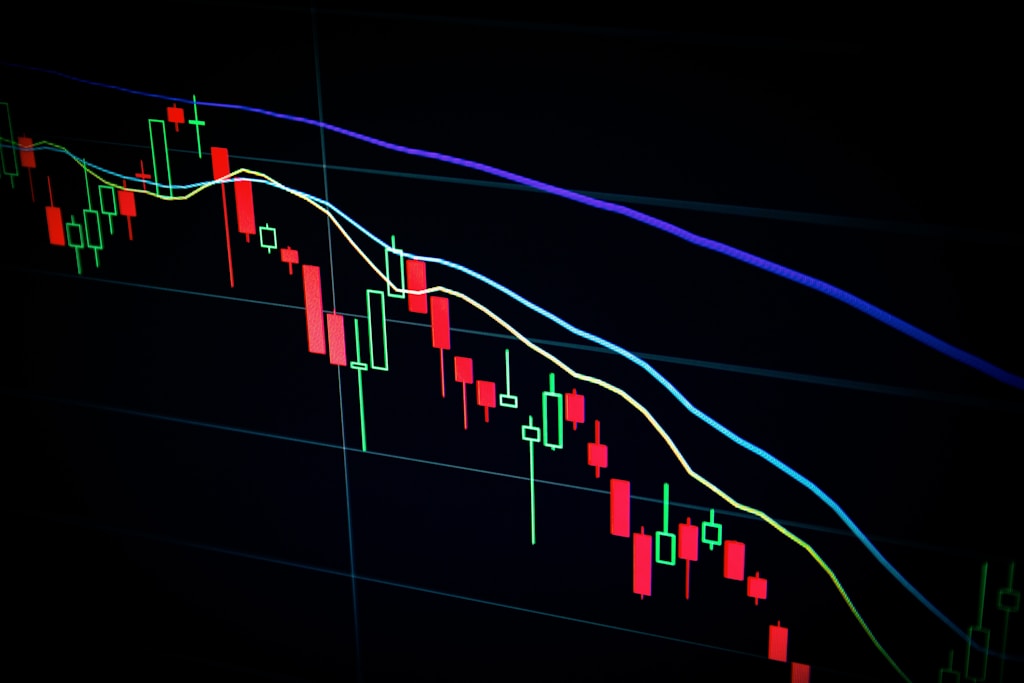
    The technical case for DOGE’s upside potential stems from a critical trendline breakout in late 2023. This technical development has established a series of higher highs and higher lows, with strong support holding at $0.15. Multiple analysts have identified similar bullish patterns, suggesting significant upside potential.

    SPONSORED

    Trade DOGE with up to 100x leverage on perpetual contracts

    Trade Now on Defx

    Key Resistance Levels to Watch

    Market analyst Ali Martinez identifies the $0.25-$0.26 range as the immediate resistance zone. This area previously served as support in December 2024 before converting to resistance in early 2025. A decisive break above this level could trigger the projected rally toward $0.65.

    On-Chain Metrics Support Bullish Case

    Supporting the bullish outlook, on-chain data shows remarkable growth in network activity:

    • New addresses: 100% increase in 7 days
    • Active addresses: 110% growth
    • Zero-balance addresses: 155% surge

    Price Targets and Risk Factors

    While the primary target sits at $0.65 (174% upside), Marks also outlined potential extensions to $0.74 and $1.25. However, traders should note several risk factors:

    • Immediate resistance at $0.26 must be cleared
    • Volume confirmation needed above $0.28
    • Support at $0.21 must hold to maintain bullish structure

    FAQ Section

    What is the next major price target for Dogecoin?

    The primary target is $0.65, representing a 174% increase from current levels.

    What key support level must hold for the bullish case?

    The $0.21 level serves as crucial support that must hold to maintain the bullish market structure.

    What on-chain metrics support the bullish outlook?

    Network activity shows significant growth, with new addresses up 100%, active addresses increasing 110%, and zero-balance addresses rising 155% in the past week.

  • Ethereum Price Shows Bullish Pattern at $2,540: $2,650 Break Imminent?

    Ethereum Price Shows Bullish Pattern at $2,540: $2,650 Break Imminent?

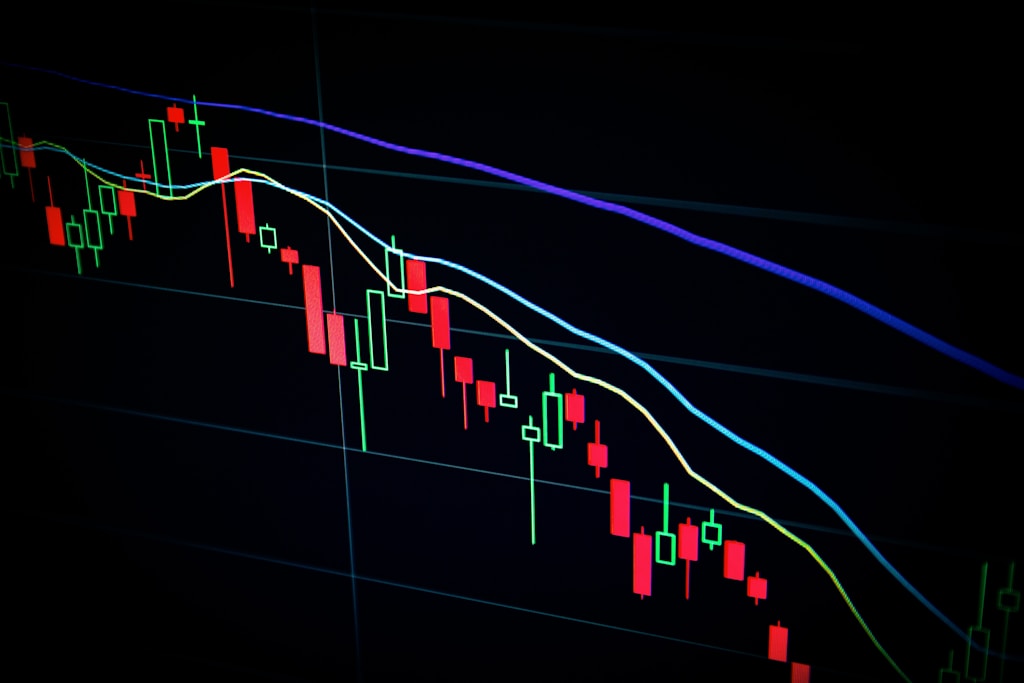
    Ethereum (ETH) is showing strong bullish momentum after finding critical support at $2,320, with technical indicators suggesting a potential breakthrough above the key $2,650 resistance level. Recent golden cross formation adds further credence to the bullish outlook as ETH maintains its position above crucial moving averages.

    Key Technical Developments for Ethereum

    • Support established at $2,320 with strong buyer presence
    • Price trading confidently above $2,500 and 100-hourly SMA
    • Breakout above bearish trendline at $2,530
    • 76.4% Fibonacci retracement level cleared

    Critical Price Levels to Watch

    The recent price action has established several crucial technical levels that traders should monitor:

    Support Levels Resistance Levels
    $2,450 $2,580
    $2,420 $2,650
    $2,320 $2,720

    SPONSORED

    Trade Ethereum with up to 100x leverage on perpetual contracts

    Trade Now on Defx

    Bullish Scenario and Targets

    A decisive break above $2,650 could trigger a significant rally toward $2,720, with extended targets at $2,780 and $2,840. The bullish MVRV ratio supports the potential for higher prices, suggesting accumulation at current levels.

    Risk Factors and Support Zones

    Failure to breach $2,650 could lead to a retest of support at $2,520. The critical support zone between $2,450 and $2,420 must hold to maintain bullish momentum.

    Technical Indicator Analysis

    • MACD: Showing increasing bullish momentum
    • RSI: Above 50, indicating healthy buying pressure
    • Moving Averages: Price above key SMAs, confirming uptrend

    Frequently Asked Questions

    What is the next major resistance for Ethereum?

    The immediate major resistance lies at $2,650, followed by $2,720.

    Where is the critical support level for ETH?

    The primary support zone is at $2,450, with secondary support at $2,320.

    What technical indicators support the bullish case?

    The MACD momentum, RSI above 50, and price action above key moving averages all support bullish momentum.

  • Bitcoin at $103K Shows Room for Growth: Mayer Multiple Analysis

    Bitcoin at $103K Shows Room for Growth: Mayer Multiple Analysis

    Bitcoin’s recent surge to $103,000 has sparked discussions about market overheating, but a detailed analysis of the Mayer Multiple suggests there’s still significant room for growth in the current bull cycle.

    Understanding the Mayer Multiple Indicator

    The Mayer Multiple, a key technical indicator tracking Bitcoin’s relationship with its 200-day moving average, currently shows surprisingly moderate readings despite BTC’s impressive price level. This analysis gains particular significance in light of Bitcoin’s historic weekly close above $106K, suggesting a measured climb rather than excessive speculation.

    SPONSORED

    Maximize your Bitcoin trading potential with up to 100x leverage

    Trade Now on Defx

    Key Findings from the Z-Score Analysis

    The current Mayer Multiple Z-Score remains below its historical mean, with 53% of previous readings showing higher values. This technical positioning suggests Bitcoin’s current price level of $103,000 represents a relatively sustainable growth trajectory rather than a market top.

    Historical Context and Future Implications

    While the indicator has shown improvement from early 2024 lows, it hasn’t reached the extreme levels witnessed during the 2021 bull run. This pattern aligns with recent analysis of funding rates indicating sustainable growth toward higher price targets.

    Market Outlook and Trading Implications

    Current market conditions suggest potential for continued upward momentum, with the next major resistance levels likely emerging as the Z-Score approaches historical mean values. Traders should monitor this indicator alongside other metrics for comprehensive market analysis.

    Frequently Asked Questions

    What is the Mayer Multiple indicating about current Bitcoin prices?

    The Mayer Multiple suggests Bitcoin at $103,000 is not overheated, with current readings below historical averages.

    How does this compare to previous bull markets?

    Current readings are notably lower than those seen during the 2021 bull run, indicating potential room for growth.

    What are the implications for traders?

    The moderate readings suggest opportunities for continued upside while maintaining reasonable risk management strategies.

  • Bitcoin Price Eyes $110K: Technical Indicators Signal New ATH Push

    Bitcoin’s price trajectory is showing strong bullish momentum as BTC cleared the crucial $106,000 resistance level, with technical indicators suggesting a potential push toward $110,000 and a new all-time high. This analysis comes as Bitcoin’s historic weekly close above $106K continues to influence market sentiment.

    Key Technical Developments

    • BTC established strong support at $102,000
    • Price trading confidently above the 100-hour SMA
    • Bullish trend line forming with $105,800 support
    • Multiple resistance levels identified: $107,000, $107,500, and $108,800

    SPONSORED

    Trade Bitcoin with up to 100x leverage and maximize your profit potential

    Trade Now on Defx

    Technical Analysis Deep Dive

    The current price action demonstrates remarkable strength, with BTC successfully clearing several key Fibonacci retracement levels. The 76.4% retracement level from the recent swing high of $107,042 has been decisively broken, suggesting strong buying pressure.

    Critical Support and Resistance Zones

    Support Levels Resistance Levels
    $105,800 $107,000
    $104,200 $107,500
    $102,500 $110,000

    Risk Assessment

    While the overall trend remains bullish, traders should monitor potential correction scenarios. A failure to break above $107,000 could trigger a pullback to key support levels.

    Technical Indicators Overview

    • MACD: Showing increasing bullish momentum
    • RSI: Trading above 50, indicating healthy buying pressure
    • Moving Averages: Price above key SMAs, confirming uptrend

    FAQ

    What’s driving Bitcoin’s current price surge?

    Technical breakouts combined with strong institutional buying pressure are primary catalysts for the current rally.

    Could Bitcoin reach $110,000 in the near term?

    Technical indicators suggest this is possible if current momentum continues and key resistance levels are broken.

    What are the main risks to watch?

    Key risks include potential rejection at $107,000 and broader market volatility affecting crypto assets.

  • Bitcoin Price Top Prediction: New Macro Oscillator Shows Bullish 2025 Outlook

    Bitcoin Price Top Prediction: New Macro Oscillator Shows Bullish 2025 Outlook

    Bitcoin’s volatile price action has captured market attention as it briefly touched $106,000 before consolidating around $103,000. A sophisticated new tool, the Decode Macro Trend Oscillator (MTO), suggests this may be just the beginning of a larger upward move. Recent historic price levels above $106,000 have set the stage for what could be an extended bull run.

    Understanding the Macro Trend Oscillator’s Bitcoin Predictions

    The Decode Macro Trend Oscillator represents a breakthrough in Bitcoin market analysis, aggregating 40 macroeconomic indicators into 17 key metrics. These include interest rates, global liquidity measures, and market volatility data points that have historically preceded major Bitcoin price movements.

    SPONSORED

    Trade Bitcoin with up to 100x leverage on perpetual contracts

    Trade Now on Defx

    Historical Accuracy and Current Readings

    The oscillator’s track record is particularly noteworthy, having accurately identified Bitcoin’s major cycle peaks in 2013, 2017, and 2021. Currently, the indicator sits at -11.47 in the red zone, suggesting significant upside potential before reaching a cycle top. This aligns with recent data showing increasing long-term holder accumulation.

    Bitcoin Mode Configuration and Market Implications

    When configured specifically for Bitcoin analysis, the oscillator’s specialized ‘Bitcoin Mode’ focuses on metrics with the strongest correlation to crypto market cycles. The current reading suggests Bitcoin’s price top is unlikely to materialize in 2025, indicating potential for continued upward momentum.

    Key Factors Supporting Extended Bull Run

    • Negative histogram readings despite recent price increases
    • Historical correlation with S&P 500 patterns
    • M2 money supply growth indicators
    • Macro environment similarities to previous bull cycles

    FAQ Section

    When will Bitcoin reach its cycle top according to the MTO?

    Based on current readings, the cycle top is not expected in 2025, with the oscillator suggesting several months of upside potential remaining.

    How accurate has the Macro Trend Oscillator been historically?

    The tool has successfully identified major Bitcoin cycle peaks in 2013, 2017, and 2021, demonstrating strong historical accuracy.

    What are the key indicators to watch?

    Investors should monitor the transition from red to green in the histogram, particularly the appearance of the first deep green bars, which historically signal approaching cycle peaks.

    At time of publication, Bitcoin trades at $103,300, maintaining strong support levels as macro indicators suggest continued upward potential.

  • Bitcoin Rally Shows Healthy Growth: Funding Rates Signal Sustainable $100K Push

    Bitcoin’s latest surge beyond $100,000 is displaying markedly different characteristics from previous rallies, suggesting a more sustainable upward trajectory that could support long-term price appreciation. On-chain analysis reveals compelling evidence of a maturing market with reduced leverage risk.

    Understanding Bitcoin’s Current Market Health

    According to CryptoQuant analysis, Bitcoin’s climb from $74,508 to over $100,000 exhibits notably healthier market indicators compared to previous bull runs. This development coincides with significant institutional interest, as evidenced by recent whale activity supporting key price levels.

    Key Market Indicators Show Reduced Risk

    The most striking difference in the current rally is the absence of overheated funding rates, traditionally a reliable predictor of market corrections. Historical data shows that previous bull runs were characterized by sharp spikes in Binance market buy volume and funding rates, often leading to substantial pullbacks.

    SPONSORED

    Trade Bitcoin with up to 100x leverage on perpetual contracts

    Trade Now on Defx

    Long-term Holder Behavior Supports Bullish Outlook

    On-chain metrics indicate that long-term holders are maintaining their positions despite BTC trading near its previous ATH of $108,786. This behavior pattern aligns with recent data showing a 10% surge in long-term holder supply, suggesting strong confidence in further price appreciation.

    Market Outlook and Risk Factors

    While current indicators paint a positive picture, analysts maintain measured optimism. The market still needs to demonstrate sustained buying pressure above key resistance levels for confirmation of the bullish trend. At press time, BTC trades at $102,393, representing a modest 1.4% daily decline.

    Frequently Asked Questions

    Why is the current Bitcoin rally considered healthier?

    The current rally shows stable funding rates and controlled market buy volume, indicating more sustainable growth compared to previous volatile periods.

    What role do funding rates play in Bitcoin price action?

    Funding rates indicate the cost of maintaining leveraged positions and can predict potential market corrections when they become overheated.

    How does long-term holder behavior impact Bitcoin’s price?

    Long-term holder accumulation typically reduces available supply and can create upward price pressure when combined with new demand.

  • Dogecoin Price Eyes $0.50 Breakout as Multiple Analysts Signal Rally

    Dogecoin Price Eyes $0.50 Breakout as Multiple Analysts Signal Rally

    The Dogecoin (DOGE) price appears poised for a significant breakout, with multiple crypto analysts identifying technical patterns that suggest an imminent rally to $0.50. As DOGE tests critical support at $0.21, market watchers are closely monitoring key technical indicators that could trigger the next major move.

    Technical Analysis Points to Major DOGE Breakout

    Renowned crypto analyst Marco Polo has identified a classic price setup that could propel Dogecoin toward the $0.50 mark. The analysis reveals that DOGE has successfully broken out of a falling wedge pattern that has been intact for over a year, suggesting strong bullish momentum.

    Key technical factors supporting the bullish case include:

    • Higher lows formation since June 2023
    • Clear diagonal breakout pattern
    • Strong support at the $0.21 level
    • Potential catalyst at $0.25 resistance

    SPONSORED

    Trade DOGE with up to 100x leverage on perpetual contracts

    Trade Now on Defx

    Multiple Analysts Confirm Bullish Outlook

    Supporting Marco Polo’s analysis, crypto expert Master Kenobi suggests that DOGE could reach as high as $14 if it touches the upper trendline of an ascending channel. This ambitious target is backed by historical price action and current market dynamics.

    Additional Bullish Indicators Emerge

    Trader Tardigrade has identified several technical factors supporting a potential DOGE rally:

    • Channel breakout confirmation
    • Compelling 2-month Bollinger BandWidth readings
    • Short-term target of $1.00
    • Long-term potential for $30 by 2026

    Current Market Position

    DOGE is currently trading at $0.21, showing signs of consolidation before its next major move. Recent price action below $0.23 has created a critical support zone that bulls must defend to maintain momentum.

    FAQ Section

    What is the next major resistance level for Dogecoin?

    The immediate resistance level is at $0.25, followed by significant resistance at $0.50.

    How long could this rally take to materialize?

    Based on historical patterns, significant moves in DOGE typically develop within 2-4 weeks of pattern confirmation.

    What are the key risk factors to watch?

    Traders should monitor the $0.21 support level and overall market sentiment, as a break below could invalidate the bullish setup.

  • Bitcoin’s $10K Pattern Signals Strong Push Toward $115K Target

    Bitcoin’s methodical price action is revealing a fascinating pattern that could signal significant upside potential. The leading cryptocurrency has been steadily climbing in $10,000 increments, suggesting a calculated march toward new highs.

    After experiencing turbulence earlier this year with a sharp decline from $109,000 to $74,600, Bitcoin has shown remarkable resilience. Recent whale activity supporting the $103K level has helped establish a solid foundation for further gains.

    The $10,000 Stair-Step Pattern

    Technical analyst Trader Tardigrade has identified a consistent pattern in Bitcoin’s recent price action. The cryptocurrency has been advancing in clear $10,000 intervals, with each surge followed by a 7-10 day consolidation period. This methodical progression has taken Bitcoin from $75,000 to its current trading range above $100,000.

    SPONSORED

    Trade Bitcoin with up to 100x leverage on perpetual contracts

    Trade Now on Defx

    Key Support Levels and Market Psychology

    The psychological $100,000 level has become a crucial support zone. Bitcoin’s historic weekly close above $106K demonstrates the strength of this upward momentum. Each consolidation phase has created new support levels, reducing the risk of significant pullbacks.

    Long-term Projections Point Higher

    While the immediate target sits at $115,000, some analysts are looking much further ahead. CryptoCon’s analysis using the Golden Ratio Multiplier suggests potential targets as high as $160,000. This projection aligns with historical patterns, particularly the 2015-2017 bull cycle.

    FAQ

    Q: What is driving Bitcoin’s current price action?
    A: A combination of technical patterns, strong holder behavior, and institutional adoption is supporting the steady price increases.

    Q: How reliable is the $10,000 increment pattern?
    A: While past performance doesn’t guarantee future results, the pattern has shown consistency over multiple cycles since reaching $75,000.

    Q: What could invalidate this bullish scenario?
    A: A break below the $100,000 support level or failure to maintain the established pattern could signal a shift in market dynamics.

  • Bitcoin Price Makes History: Weekly Close Above $106K Signals New Era

    Bitcoin Price Makes History: Weekly Close Above $106K Signals New Era

    Bitcoin has achieved a historic milestone, marking its highest-ever weekly close at $106,516 as institutional adoption continues to drive the leading cryptocurrency to new heights. This breakthrough weekly close aligns with recent predictions of a $120K target, suggesting strong momentum in the current rally.

    Breaking Down Bitcoin’s Historic Weekly Close

    The landmark weekly close occurred on Sunday evening, with Bitcoin settling at $106,516, demonstrating remarkable strength in the broader crypto market. As of Monday’s trading, BTC maintains strong support above $102,000, indicating sustained buyer interest at these elevated levels.

    SPONSORED

    Trade Bitcoin with up to 100x leverage and maximize your profit potential

    Trade Now on Defx

    Statistical Significance of the $106K Level

    On-chain researcher Dan’s analysis reveals the extraordinary nature of this achievement:

    • Only 0.02% of Bitcoin’s trading history has seen prices above $106,439
    • Just 40 days total have recorded closes above $100,000
    • Price levels above $75,000 have occurred on only 181 days
    • $50,000+ closes represent merely 586 days of trading

    Market Dynamics and Institutional Interest

    Recent ETF inflows reaching $260M have played a crucial role in pushing Bitcoin to these new heights. The sustained institutional interest, particularly from major players like BlackRock and Fidelity, continues to provide strong support for Bitcoin’s price action.

    Technical Analysis and Future Outlook

    The $100,000 level now serves as a critical psychological and technical support zone. Market analysts are closely monitoring several key indicators:

    • Network transaction volumes
    • Address growth metrics
    • Long-term holder behavior
    • ETF inflow patterns

    Frequently Asked Questions

    What makes this weekly close significant?

    This represents Bitcoin’s first-ever weekly close above $106,000, occurring in just 0.02% of its trading history.

    How does this compare to previous price milestones?

    The $106K level is significantly rarer than previous milestones, with even $75,000+ closes occurring on only 181 days historically.

    What factors are driving this price action?

    A combination of institutional adoption, ETF inflows, and strong network fundamentals are supporting Bitcoin’s price growth.

    As Bitcoin continues to establish new price territories, the market remains focused on key support levels and institutional participation patterns. The historic weekly close above $106K may signal the beginning of a new phase in Bitcoin’s market maturity and adoption cycle.

  • Ethereum Golden Cross Emerges: ETH Eyes $3,000 as Bulls Defend $2,400

    Ethereum (ETH) has reached a critical juncture in its price action, with a newly confirmed Golden Cross pattern on the 12-hour chart offering hope to bulls even as the cryptocurrency struggles to maintain support at $2,400. This technical development comes at a pivotal moment, as Ethereum’s recent strength relative to Bitcoin faces its first major test.

    Golden Cross Formation Signals Potential Bullish Momentum

    According to prominent analyst Ted Pillows, Ethereum’s 50-period moving average has crossed above the 200-period moving average on the 12-hour timeframe, forming a Golden Cross – a pattern historically associated with extended bullish trends. This technical signal gains additional significance given ETH’s recent 12% decline from last Tuesday’s highs.

    SPONSORED

    Trade ETH with up to 100x leverage and maximize your potential returns

    Trade Now on Defx

    Critical Support Levels Under Pressure

    The $2,400 support zone has become increasingly important as ETH consolidates following a volatile weekend that saw prices spike to $2,670 before sharply reversing. This price action aligns with broader market uncertainty around key resistance levels, suggesting that the coming days will be crucial for determining medium-term direction.

    Technical Analysis and Price Targets

    Key technical levels to watch include:

    • Immediate support: $2,390-$2,400
    • Secondary support: $2,200-$2,300
    • Critical resistance: $2,550-$2,600
    • Golden Cross target: $3,000

    FAQs About Ethereum’s Golden Cross

    What is a Golden Cross?

    A Golden Cross occurs when a shorter-term moving average crosses above a longer-term moving average, typically signaling the potential start of a bullish trend.

    How reliable are Golden Cross signals?

    While historically significant, Golden Cross signals should be considered alongside other technical indicators and market conditions for more reliable trading decisions.

    What could invalidate the bullish setup?

    A decisive break below the $2,390 support level could trigger a deeper correction and potentially invalidate the bullish implications of the Golden Cross.

    Time will tell whether this Golden Cross marks the beginning of Ethereum’s next major uptrend or if more consolidation is needed before a sustained move higher can materialize.