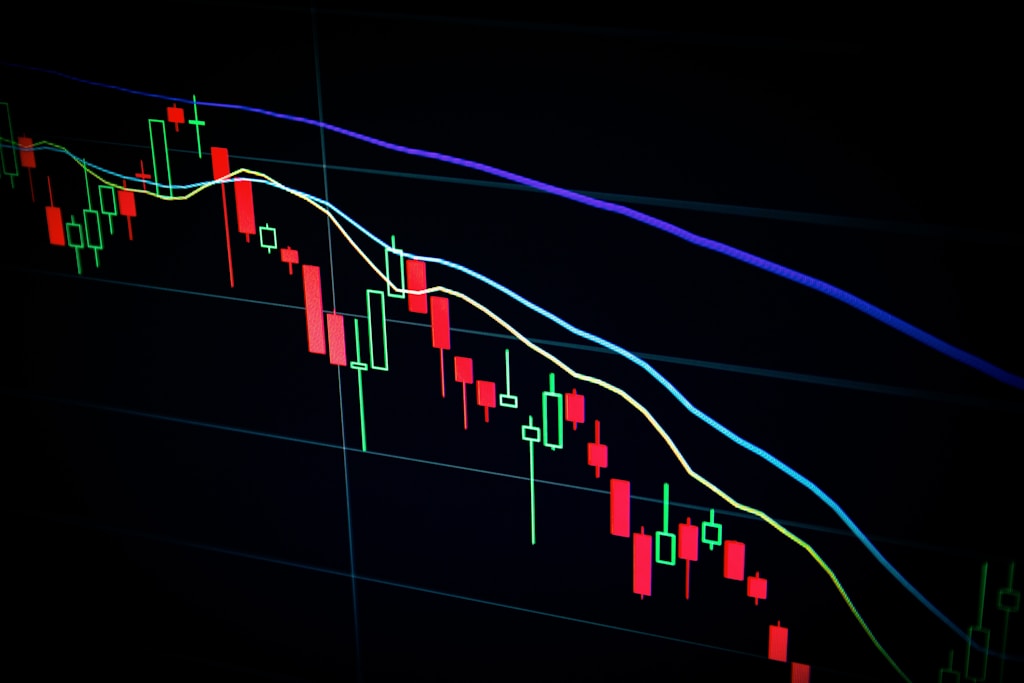
Bitcoin (BTC) continues its impressive rally in 2025, with on-chain metrics suggesting a potential peak of $120,000 – but only if crucial support levels hold. The premier cryptocurrency has surged over 37.5% since mid-April, climbing from below $75,000 to recent highs of $105,490, as institutional interest remains strong.
CVDD Analysis Points to $120K Target
According to renowned crypto analyst Ali Martinez, Bitcoin’s Cumulative Value Days Destroyed (CVDD) metric is painting a bullish picture for BTC’s next major move. The CVDD, which tracks long-term holder spending behavior, currently sits at $34,154 and provides critical insights into potential price targets.
CryptoQuant’s analysis of the CVDD metric reveals multiple significant price levels:
- Current CVDD base: $34,154
- Critical support level: $90,000
- Projected peak: $120,000
This analysis aligns with previous technical projections showing Bitcoin’s path to $115K, suggesting a confluence of bullish indicators.
SPONSORED
Trade Bitcoin with up to 100x leverage and maximize your profit potential
Market Structure and Support Levels
The current Bitcoin price of $103,573 represents a delicate position in the market structure. Key levels to watch include:
- Immediate resistance: $105,000
- Critical breakout level: $107,000
- Major support: $90,000
Institutional Interest Remains Strong
Bitcoin Spot ETFs continue to demonstrate robust demand, recording $1.81 billion in net inflows over the past week. This sustained institutional interest supports the bullish narrative, with Bitcoin’s market dominance holding steady at 62.8% of the total crypto market cap.
FAQ Section
What is the CVDD metric?
The Cumulative Value Days Destroyed (CVDD) measures the spending behavior of long-term Bitcoin holders, helping identify potential market tops and bottoms.
Why is the $90K level important?
The $90,000 level represents a critical support zone that must hold to maintain the bullish structure needed for reaching the projected $120,000 target.
What could prevent Bitcoin from reaching $120K?
A breakdown below the $90,000 support level or significant reduction in institutional interest could derail the projected path to $120,000.


