XRP Price Risks Breaking $2 Support as Head and Shoulders Pattern Confirms
XRP's price action is showing increasing bearish momentum as a critical technical pattern suggests an imminent breakdown below the psychological...
XRP's price action is showing increasing bearish momentum as a critical technical pattern suggests an imminent breakdown below the psychological...

Solana (SOL) is showing remarkable resilience amid broader market turbulence, with a key technical indicator flashing a potential buy signal...
Bitcoin (BTC) has formed a significant Golden Cross pattern that historically precedes major rallies, suggesting the recent pullback to $100,000...

Bitcoin's price trajectory is showing strong bullish signals, with a prominent technical analyst identifying a pattern that could propel BTC...
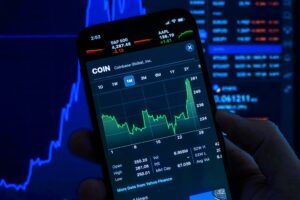
Key Takeaways:XRP trading at $2.19 with $128B market cap24-hour volume reaches $1.33B amid tight consolidationTechnical pattern suggests potential breakout aheadXRP,...
Ethereum (ETH) has demonstrated remarkable resilience amid heightened market volatility, maintaining critical support at $2,400 despite a sharp 10% pullback...
Reading Time: 8 minutes Bitcoin's price action is showing a highly bullish technical formation as the leading cryptocurrency consolidates near...
Bitcoin's recent pullback from its $112,000 all-time high has created a notable divergence between institutional and retail investors, with on-chain...

Bitcoin (BTC) appears to be following a familiar pattern that could propel its price to $120,000, according to multiple analysts...

The Dogecoin (DOGE) price is facing a decisive moment as it approaches a critical support level at $0.16 following a...


