Tag: technical analysis

  • Solana Price Tests $185 Resistance as Capital Inflows Signal Bullish Trend

    Solana (SOL) is showing renewed strength as it tests critical resistance levels, with on-chain data revealing a significant shift in capital flows that could signal the start of a fresh bullish phase. The cryptocurrency recently touched a local high of $184 before encountering selling pressure, with bulls now defending the crucial $170 support zone.

    According to recent Glassnode data, Solana has reversed months of negative realized cap flows, with 30-day capital inflows turning positive and growing at an impressive 4-5% rate. This growth rate mirrors the momentum seen in XRP’s recent price action, which has analysts predicting significant upside potential.

    SPONSORED

    Trade Solana with up to 100x leverage on perpetual contracts

    Trade Now on Defx

    Technical Analysis Points to Critical Price Levels

    SOL currently trades at $170.48, maintaining position above both the 200-day EMA ($162.21) and approaching the significant 200-day SMA ($181.16). The recent price action has established several key levels that traders should monitor:

    • Immediate Resistance: $185
    • Critical Support: $170
    • Secondary Support: $162 (200-day EMA)
    • Upside Target: $200-$220 range

    On-Chain Metrics Show Growing Institutional Interest

    The positive shift in capital flows suggests increasing institutional interest in Solana’s ecosystem. This trend aligns with broader market momentum that has seen $35B in fresh inflows across the crypto sector, indicating growing confidence in digital assets.

    FAQs About Solana’s Recent Price Action

    Q: What’s driving Solana’s current price movement?
    A: The combination of positive capital inflows, technical strength above key moving averages, and broader market optimism are primary drivers.

    Q: What are the key resistance levels to watch?
    A: The immediate resistance at $185 is crucial, with the $200-$220 range representing the next major target zone.

    Q: How significant is the current capital inflow data?
    A: The 4-5% growth rate in capital inflows represents a major reversal from previous outflows, suggesting renewed institutional confidence.

    Looking Ahead: Key Catalysts and Risk Factors

    While the technical and on-chain metrics paint a bullish picture, traders should remain mindful of potential risks. The ability to hold above $170 will be crucial for maintaining bullish momentum. A breakdown below this level could trigger a retest of lower support zones.
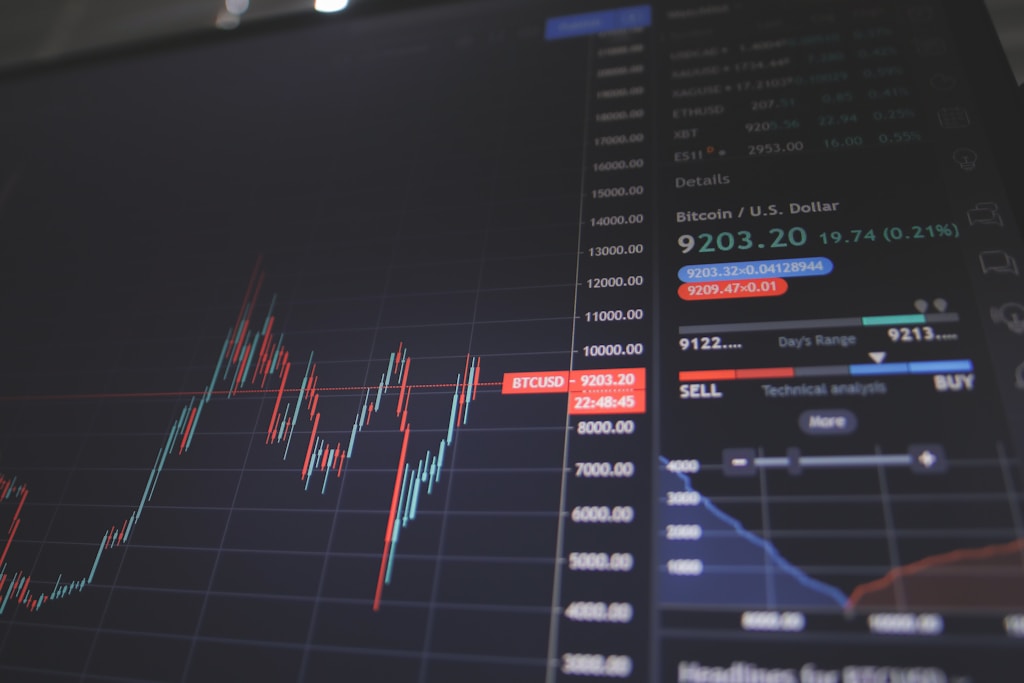

  • Bitcoin Price at Critical $102K Level: Analyst Reveals Next Key Targets

    Bitcoin Price at Critical $102K Level: Analyst Reveals Next Key Targets

    Bitcoin’s price action has entered a decisive phase as the leading cryptocurrency hovers near $102,352, with renowned analyst Tony “The Bull” Severino identifying crucial levels that could determine the next major move. Recent market sentiment suggests a strong bullish bias, with 37% of traders targeting $150,000 by year-end, though technical indicators present a more nuanced picture.

    Key Technical Levels Under Watch

    The cryptocurrency is currently testing a significant resistance zone around $108,000, with three potential scenarios emerging from the current market structure:

    • Bullish Case: Consolidation below resistance leading to upward continuation
    • Neutral Case: Formation of a broad trading range between support and resistance
    • Bearish Case: Possible reversal signaled by doji candlestick formation

    Volume and Momentum Analysis

    Despite the broader market showing strength, several technical indicators suggest caution:

    • Trading volume down 11.40% to $44.33 billion
    • RSI failing to breach 70 on CME Futures chart
    • Weekly candlestick forming potential reversal pattern

    SPONSORED

    Trade Bitcoin with precision using advanced charting and up to 100x leverage

    Trade Now on Defx

    Strategic Trading Positions

    Severino’s current trading strategy reflects market uncertainty:

    • Short positions placed in resistance zone ($108,000)
    • Stop loss positioned above all-time high
    • Stop buy orders set in breakout zone

    Conditions for Bullish Continuation

    For a confirmed bullish breakout, the following conditions must align:

    • Substantial increase in trading volume
    • Weekly RSI reading above 70
    • Weekly close above upper Bollinger Band

    Recent data shows increasing selling pressure from long-term holders, adding another layer of complexity to the current market structure.

    FAQ Section

    What are the key resistance levels for Bitcoin?

    The primary resistance zone is currently at $108,000, with secondary resistance at the all-time high level.

    What trading volume is needed for a breakout?

    A sustained breakout would require daily trading volume above the current $44.33 billion level, preferably exceeding $50 billion.

    What technical indicators support a bullish case?

    Strong market breadth and positive altcoin performance support the bullish case, though volume and momentum indicators currently show mixed signals.

  • Dogecoin Price Eyes $0.40 Target After Key Consolidation Pattern Forms

    Dogecoin (DOGE) has entered a strategic consolidation phase that could set up the popular meme coin for a major rally to $0.40, according to leading crypto analysts. This technical development comes amid surging network activity that recently hit record levels, suggesting growing institutional interest in the asset.

    Technical Analysis Points to Bullish Setup

    After pulling back to the $0.22 support level on Wednesday, DOGE has established a tight trading range between $0.21 and $0.25. Prominent crypto analyst Trader Tardigrade views this consolidation as a healthy development that could precede a significant breakout.

    Key technical indicators supporting the bullish outlook include:

    • RSI MA showing potential for upward momentum
    • Price action forming a clear consolidation pattern near resistance
    • Active wallet addresses surging to 127,570
    • Historical precedent from November’s similar pattern

    SPONSORED

    Trade DOGE with up to 100x leverage on perpetual contracts

    Trade Now on Defx

    On-Chain Metrics Signal Growing Adoption

    The recent surge in Dogecoin network activity provides fundamental support for the technical outlook. On-chain analyst Ali Martinez notes that active wallet addresses have reached levels not seen since the previous bull run, suggesting increased adoption and potential price appreciation.

    This surge in network activity aligns with broader market momentum that recently pushed DOGE up 78%, establishing a strong foundation for further gains.

    Price Targets and Key Levels

    Based on current technical analysis, traders should watch these key levels:

    • Immediate resistance: $0.25
    • Primary target: $0.40
    • Support level: $0.21
    • Secondary support: $0.19

    FAQ

    Q: What is causing the current Dogecoin consolidation?
    A: The consolidation is primarily due to profit-taking after recent gains and traders establishing new positions near key technical levels.

    Q: How long might this consolidation last?
    A: According to analysts, the consolidation phase could last several days before a potential breakout.

    Q: What could trigger the move to $0.40?
    A: A combination of increasing network activity, technical breakout above $0.25, and broader crypto market strength could catalyze the move.

  • Ethereum Price Eyes $2.4K Support Test After 50% Rally

    Ethereum (ETH) has paused its impressive rally near $2,740 after surging over 50% in the past week, with analysts now eyeing a crucial retest of the $2,400 support level. The second-largest cryptocurrency by market cap is showing signs of consolidation after one of its strongest short-term performances in months, breaking through key resistance levels at $2,000 and $2,200 with relative ease.

    As noted in recent market analysis showing broader altcoin momentum, Ethereum’s sustained strength is fueling optimism about a potential altseason, with ETH’s breakout potentially catalyzing moves across the altcoin market.

    SPONSORED

    Trade ETH with up to 100x leverage and maximize your profit potential

    Trade Now on Defx

    Critical Support Levels to Watch

    Top crypto analyst Daan has identified $2,400 as a crucial support level that could determine ETH’s next major move. The analyst suggests this area needs to be retested for a healthier market structure, particularly given the extremely high open interest in ETH derivatives markets.

    Key levels to monitor:

    • Primary support: $2,400
    • Secondary support: $2,100
    • Current resistance: $2,700
    • Major resistance: $3,000-$3,100

    Technical Indicators and Market Structure

    ETH is currently consolidating below the 200-day SMA at $2,702.93, with declining volume suggesting a period of price discovery. The 200-day EMA near $2,437 serves as additional technical support, aligning closely with the key $2,400 level identified by analysts.

    Expert Analysis and Price Targets

    Despite short-term consolidation risks, the overall structure remains bullish as long as ETH maintains support above $2,400. A successful defense of this level could set up ETH for a push toward the $3,000-$3,100 resistance zone, though traders should remain cautious until excessive leverage is flushed from the system.

    Frequently Asked Questions

    What is causing Ethereum’s recent price surge?

    The rally has been driven by improving market sentiment, increased institutional interest, and broader crypto market momentum, particularly following Bitcoin’s strong performance.

    Why is the $2,400 level significant?

    This price point represents a key technical and psychological support level that previously acted as resistance. A successful retest would confirm the strength of the current uptrend.

    What could trigger a deeper correction?

    A loss of the $2,400 support level combined with high open interest could trigger liquidations and push ETH toward the $2,100 support zone.

  • XRP/BTC Enters Critical Trading Range: 3 Key Price Targets Emerge

    XRP has entered a pivotal trading range against Bitcoin (BTC), with technical analysis revealing three critical price targets that could signal a major macro rally. As Bitcoin whales show signs of profit-taking, XRP’s positioning becomes increasingly significant for traders.

    Breaking Down XRP’s Key Price Targets

    Market expert Egrag Crypto has identified three crucial price levels that XRP/BTC must conquer to confirm its bullish trajectory:

    • First Target: $0.000003033 – Upper boundary of the triangle formation
    • Second Target: $0.00003430 – Previous local high requiring volume confirmation
    • Third Target: $0.00004300 – Critical Fibonacci 1.0 level aligned with previous cycle high

    SPONSORED

    Trade XRP with up to 100x leverage on perpetual contracts

    Trade Now on Defx

    Fibonacci Extension Levels Paint Bullish Picture

    Beyond the initial targets, higher Fibonacci extension levels suggest significant upside potential:

    Fibonacci Level Price Target
    1.272 $0.00007244
    1.414 $0.00009546
    1.618 $0.00014191
    1.888 $0.00030000

    Critical Support Level Must Hold

    The analysis comes with a crucial warning: XRP/BTC must maintain support at $0.00002032 (0.618 Fibonacci level) to prevent a potential crash to $0.00000611. Currently trading at $0.00002516, the pair shows early recovery signs after testing lower levels.

    FAQ Section

    What makes this XRP/BTC trading range significant?

    This range represents a critical triangle formation that could determine XRP’s next major move, with potential for either a significant breakout or breakdown.

    What’s the most important support level to watch?

    The 0.618 Fibonacci level at $0.00002032 is crucial – losing this level could trigger a severe decline.

    What’s the highest potential target if all levels are broken?

    The 1.888 Fibonacci extension level at $0.00030000 represents the highest projected target in this analysis.

  • Dogecoin Price Eyes $0.32 Target After 78% Rally – Technical Analysis

    Dogecoin Price Eyes $0.32 Target After 78% Rally – Technical Analysis

    Dogecoin (DOGE) continues to demonstrate remarkable strength, surging over 78% in just 38 days as multiple technical indicators point to further upside potential. Leading crypto analysts have identified key continuation patterns that suggest the recent pullback may be temporary, with price targets extending into the mid-$0.30s.

    In line with the broader crypto market momentum seen in this year’s altcoin season rotation, Dogecoin’s technical structure remains firmly bullish despite recent profit-taking.

    Inverse Head and Shoulders Pattern Confirms Bullish Outlook

    Renowned crypto analyst Bluntz has identified a textbook inverse head-and-shoulders pattern on the 12-hour timeframe, with key levels mapped as follows:

    • Left shoulder: $0.142 (mid-March)
    • Head: $0.129 (early April)
    • Right shoulder: $0.164 (early May)
    • Neckline breakout: $0.20

    The pattern’s completion was validated by the highest 12-hour volume since February 2025, indicating strong buyer conviction rather than speculative activity.

    SPONSORED

    Trade DOGE with up to 100x leverage on perpetual contracts

    Trade Now on Defx

    Bull Flag Formation Points to $0.329 Target

    Supporting this bullish thesis, analyst TSG highlights a descending parallel channel between $0.22-$0.26, forming a classic bull flag pattern. This technical formation projects a precise target of $0.32928, aligning with the broader market’s expectations.

    Critical Support Levels to Watch

    For the bullish scenario to remain valid, DOGE must maintain support above:

    • Primary support: $0.20 (previous neckline)
    • Secondary support zone: $0.16-$0.21 (demand block)
    • Rising trendline support since April

    FAQ: Dogecoin’s Current Rally

    What’s driving Dogecoin’s current price action?

    The rally is supported by strong technical formations, increased trading volume, and broader market rotation into altcoins during the 2025 bull cycle.

    What are the key resistance levels ahead?

    Primary resistance sits at $0.26, followed by the projected target zone of $0.32-$0.33.

    What could invalidate the bullish outlook?

    A four-hour close below $0.20 would signal potential trend reversal, with further support at the $0.16-$0.21 range.

    At press time, DOGE trades at $0.228, maintaining position above critical support levels as momentum indicators suggest the recent cooling off period may set the stage for the next leg higher.

  • XRP Price Target $3: Top Analyst Who Called Previous Rally Predicts Surge

    XRP Price Target $3: Top Analyst Who Called Previous Rally Predicts Surge

    The cryptocurrency market is buzzing with anticipation as renowned analyst Crypto Michael, who accurately predicted XRP’s previous surge from $0.5, forecasts another significant price movement for the digital asset. With XRP currently maintaining crucial support at $2.48, the stage appears set for a potential breakout above the psychological $3 barrier.

    Technical Analysis Points to Historic XRP Breakout

    Crypto Michael’s analysis centers on a remarkable 7-year bull pennant formation that preceded XRP’s current rally. This technical pattern, combined with strong market fundamentals, suggests that XRP could be preparing for one of the most significant breakouts in cryptocurrency history. The altcoin has already demonstrated its potential by becoming 2024’s second-best performer among top 10 cryptocurrencies.

    SPONSORED

    Trade XRP with up to 100x leverage on perpetual contracts

    Trade Now on Defx

    Key Price Levels and Resistance Analysis

    According to analyst CasiTrade, XRP needs to break and hold above $2.69 to trigger an explosive move beyond $3. Supporting this outlook, Ali Martinez’s analysis of Glassnode data reveals a notable absence of major resistance clusters ahead, with key support established at $2.38.

    Double-Digit Price Predictions from Multiple Analysts

    Several prominent analysts have issued bold predictions for XRP’s future price action:

    • Pepa: Projects $30 by year-end or early next year
    • CrediBULL Crypto: Forecasts $28 by end of 2025 (Wave 5 completion)
    • Egrag Crypto: Predicts range between $27-$33
    • Mikybull Crypto: Conservative estimate of $4-$6

    Current Market Status and Trading Conditions

    As of the latest market data, XRP is trading at $2.52, showing a minor 2% decline over 24 hours. However, the broader technical setup remains bullish, supported by strong fundamentals and increasing institutional interest in the cryptocurrency sector.

    FAQ Section

    What is the next major resistance level for XRP?

    The next significant resistance level is at $2.69, which needs to be broken for a potential surge to $3.

    When could XRP reach its new all-time high?

    Based on current analyst predictions, XRP could reach new all-time highs above $3.84 within the next few months, potentially by end of 2025.

    What technical indicators support the bullish XRP prediction?

    The 7-year bull pennant formation, lack of major resistance clusters, and strong support at $2.38 are key technical indicators supporting the bullish outlook.

  • Bitcoin MACD Signal Predicts $200K Target: Top 4 Altcoins to Watch

    Bitcoin MACD Signal Predicts $200K Target: Top 4 Altcoins to Watch

    A historic Bitcoin technical indicator that accurately predicted the 2023 and 2024 bull runs has just flashed green, suggesting BTC could reach $200,000. The MACD histogram’s latest bullish flip comes as Bitcoin tests critical resistance at $105,000, setting up what could be a monumental rally.

    Understanding the MACD Signal

    The Moving Average Convergence Divergence (MACD) histogram has demonstrated remarkable accuracy, with a success rate exceeding 83% in predicting major Bitcoin price movements. This technical indicator combines multiple moving averages to identify trend changes and momentum shifts.

    SPONSORED

    Trade Bitcoin with up to 100x leverage and capitalize on the next rally

    Trade Now on Defx

    Historical Performance and Current Implications

    The MACD histogram’s recent transition to green mirrors similar signals from October 2024, October 2023, and August 2022 – each preceding significant BTC rallies. This pattern, combined with strong accumulation signals from exchange outflows, suggests substantial upside potential.

    Top 4 Altcoins Positioned for Growth

    1. BTC Bull Token ($BTCBULL)

    This innovative token combines Bitcoin price action with deflationary tokenomics and unique BTC airdrops triggered by Bitcoin’s price milestones.

    2. OFFICIAL TRUMP ($TRUMP)

    Following a 12,000% surge and subsequent correction, this politically-aligned token has shown renewed strength with a 60% monthly gain.

    3. Solaxy ($SOLX)

    As Solana targets $360, this Layer 2 scaling solution addresses critical network congestion issues.

    4. ai16z ($AI16Z)

    This AI-driven venture capital token has demonstrated impressive growth with a 120% monthly increase and strong technical setup.

    Risk Management Considerations

    While technical indicators suggest bullish momentum, investors should maintain prudent position sizing and risk management strategies given crypto market volatility.

    FAQ Section

    • What is the MACD histogram’s accuracy rate?
      The indicator has correctly predicted 5 out of 6 major Bitcoin moves, achieving an 83% accuracy rate.
    • When is the first BTC Bull Token airdrop?
      The first airdrop triggers when Bitcoin reaches $150,000.
    • What makes Solaxy unique?
      It’s the first Layer 2 scaling solution specifically designed for Solana.
  • XRP Price Faces Double Rejection at $2.65 – Critical Support at $2.37

    XRP Price Faces Double Rejection at $2.65 – Critical Support at $2.37

    XRP’s price action has hit a critical juncture after facing two consecutive rejections at key resistance levels, potentially signaling a shift in market momentum. Recent analysis had shown XRP holding strong support at $2.48, but the latest price action suggests increasing selling pressure at higher levels.

    Technical Analysis Shows Weakening Momentum

    Market analyst Andrew Griffiths has identified a concerning pattern in XRP’s recent price movement, with rejections occurring at $2.65 and $2.57 respectively. The secondary rejection at a lower level indicates growing seller confidence and could forecast further downside pressure.

    A critical divergence between price and volume metrics has emerged as XRP tests these resistance levels. While prices attempted to push higher, trading volume has shown a marked decrease – a classic warning sign that typically precedes price corrections.

    SPONSORED

    Trade XRP with up to 100x leverage on perpetual contracts

    Trade Now on Defx

    Key Support Levels to Watch

    The immediate focus turns to the $2.37 support level, which has previously demonstrated strong buying interest. A break below this level could trigger a cascade of selling pressure, potentially leading to a deeper retracement.

    RSI Indicates Potential Upside

    Despite the bearish signals, the Relative Strength Index (RSI) remains in favorable territory, suggesting that bulls haven’t completely lost control. This technical indicator continues to show potential for upward movement, particularly if XRP can overcome current resistance levels.

    FAQ Section

    Q: What are the key resistance levels for XRP?
    A: The primary resistance levels are at $2.65 and $2.57, with both showing recent rejection patterns.

    Q: Where is the critical support level?
    A: The key support level to watch is $2.37, which has historically provided strong price support.

    Q: What does the volume analysis suggest?
    A: Decreasing volume during price increases suggests weakening bullish momentum and potential for a price correction.

    Market Outlook

    The current market structure presents a mixed picture for XRP traders. While technical indicators show some bullish potential, the recent rejection patterns and volume analysis suggest caution. Traders should watch the $2.37 support level closely, as it could determine the next major price movement.

  • Bitcoin Price Dips 2.8% as US Wholesale Data Signals Fed Policy Shift

    Bitcoin’s price experienced a notable decline following weaker-than-expected US wholesale price data, highlighting the cryptocurrency’s continued sensitivity to macroeconomic indicators. Recent analysis had shown Bitcoin testing the $105K resistance level, but today’s economic data has temporarily disrupted the upward momentum.

    Market Impact of US Wholesale Prices

    The unexpected downturn in US wholesale prices has created uncertainty in both traditional and crypto markets. Market analysts suggest this data could influence the Federal Reserve’s monetary policy decisions, particularly regarding interest rate adjustments.

    SPONSORED

    Trade Bitcoin with precision using advanced order types and up to 100x leverage

    Trade Now on Defx

    Federal Reserve Policy Implications

    As noted by market analysts, Fed Chairman Powell’s stance on policy easing could significantly impact market sentiment. The current data suggests a potential shift in the Fed’s approach, though uncertainty remains about the timing and extent of any policy changes.

    Bitcoin’s Technical Outlook

    The recent price action has established several key technical levels:

    • Immediate support: $102,850
    • Key resistance: $105,000
    • Volume profile showing decreased buying pressure

    FAQ Section

    How does wholesale price data affect Bitcoin?

    Wholesale price data influences Federal Reserve policy decisions, which in turn affect market liquidity and risk appetite, directly impacting Bitcoin’s price movements.

    What are the key support levels to watch?

    Current technical analysis indicates strong support at $102,850, with secondary support at $100,000.

    Could this dip present a buying opportunity?

    While short-term volatility persists, the broader market structure remains bullish, with institutional interest continuing to provide fundamental support.