
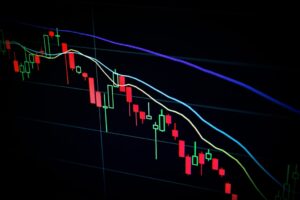
Toncoin (TON) Breaks Key Resistance: Technical Analysis Points to $5.60 Target
Toncoin (TON) is showing renewed strength after breaking out of a critical descending channel pattern, signaling a potential shift from...
Toncoin (TON) is showing renewed strength after breaking out of a critical descending channel pattern, signaling a potential shift from...
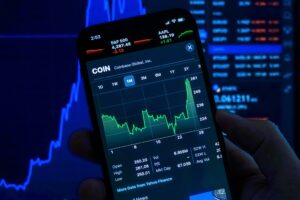
Key Takeaways:Bitcoin currently trading at $79,630 with $1.57T market cap24-hour trading range: $78,424 - $82,401Strong volume of $52.10B indicates high...

Bitcoin's price action continues to show volatility as the leading cryptocurrency failed to maintain its position above the crucial $80,000...

Bitcoin demonstrated remarkable resilience today, surging over 11% following U.S. President Donald Trump's announcement of a 90-day pause on global...
Solana (SOL) is showing remarkable resilience at the $110 support level despite significant selling pressure from major holders. The cryptocurrency...

Bitcoin's price action remains volatile despite positive macroeconomic developments, as the leading cryptocurrency whipsawed between $83,000 and $79,000 in the...
Solana (SOL) has staged a remarkable comeback, surging over 25% from its recent low of $95 as President Trump's surprise...

Bitcoin's historic 4-year cycle theory faces a critical test as the cryptocurrency struggles below $83,000, with on-chain data suggesting an...
In a remarkable display of market foresight, crypto analyst Doctor Profit, who accurately predicted Bitcoin's decline from $97,000, has released...
Dogecoin (DOGE) has experienced a dramatic 50% decline from its recent $0.5 peak, but technical analysis suggests this dip could...


