
Bitcoin Price Warning: Stochastic Data Shows Critical Divergence from 2017
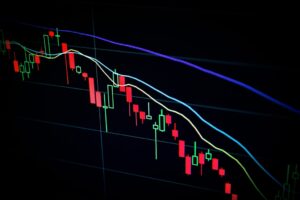
A prominent crypto analyst has issued a stark warning about Bitcoin's current market position, highlighting crucial differences from the 2017...
A prominent crypto analyst has issued a stark warning about Bitcoin's current market position, highlighting crucial differences from the 2017...

XRP's price trajectory is showing promising signs of a potential major rally, with respected analyst Egrag Crypto identifying critical Fibonacci...
Dogecoin (DOGE) faces a decisive moment as the popular meme coin tests a critical support level at $0.17, having declined...
The Ethereum (ETH) market is showing signs of a potential reversal, with multiple prominent analysts identifying the current $1,800 price...

Bitcoin (BTC) stands at a crucial technical juncture as the cryptocurrency market consolidates following weeks of sideways trading. According to...

Bitcoin's market dynamics are showing significant bullish signals as the Taker Buy Volume reaches a critical milestone amid recent macroeconomic...

Chainlink (LINK) has reached a critical juncture as on-chain data reveals a massive demand wall forming at $6.26, with approximately...

Bitcoin's price trajectory has reached a crucial juncture, with analysts identifying $69,000 as a make-or-break support level that could determine...

Ethereum (ETH) faces a critical juncture as the cryptocurrency risks dropping to 17-month lows near $1,550, according to leading analysts....
Bitcoin's price has entered what analysts are calling the 'perfect buy zone' following a dramatic 48-hour decline triggered by Donald...


