Tag: technical analysis

  • Bitcoin Price Plunges to $100K, Liquidates $837M in Crypto Positions

    Bitcoin Price Plunges to $100K, Liquidates $837M in Crypto Positions

    Key Takeaways:

    • Bitcoin drops 4% to $100,426 in significant market correction
    • $837 million in crypto positions liquidated during the downturn
    • BTC maintains historic 29-day streak above $100,000 level

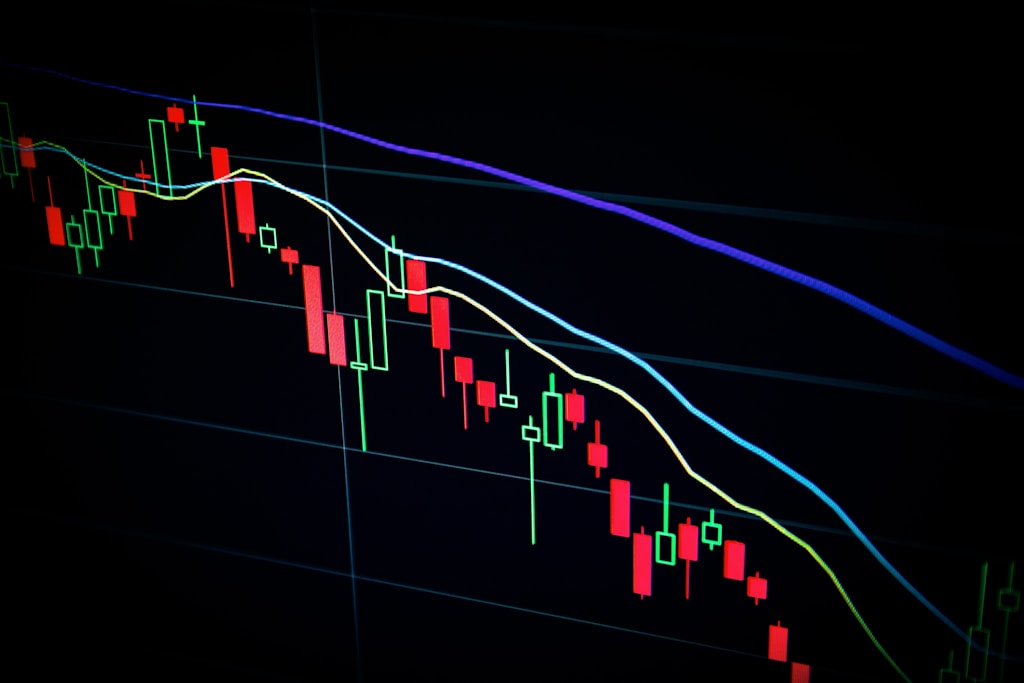
    In a dramatic turn of events for the cryptocurrency market, Bitcoin (BTC) experienced a sharp correction on Thursday, plummeting to $100,426 and triggering a cascade of liquidations across the crypto derivatives market. This price action follows Bitcoin’s recent rejection at the $106K level, suggesting increased selling pressure in the market.

    The leading cryptocurrency shed approximately 4% of its value in a single trading session, dropping from above $104,000 to approximately $100,500. Despite the significant pullback, Bitcoin has maintained its position above the psychological $100,000 threshold for an unprecedented 29 consecutive days.

    Market Impact and Liquidation Analysis

    The sudden price movement resulted in the liquidation of $837 million worth of leveraged positions across various cryptocurrency exchanges. This massive liquidation event highlights the highly leveraged nature of current market participants and the risks associated with margin trading in volatile market conditions.

    SPONSORED

    Trade Bitcoin with up to 100x leverage and protect your positions with advanced risk management tools.

    Trade Now on Defx

    Technical Analysis and Market Outlook

    The current price action suggests a potential test of lower support levels, with analysts closely monitoring the $99,000 region as crucial support. The market correction comes after significant accumulation by Bitcoin whales, who recently added 79,000 BTC worth $8.3B to their holdings.

    Frequently Asked Questions

    • What caused Bitcoin’s price drop?
      The correction appears to be driven by profit-taking after an extended period above $100,000 and overleveraged positions being forced to liquidate.
    • Will Bitcoin maintain support at $100,000?
      Technical indicators suggest strong support at this level, backed by 29 days of price stability above this threshold.
    • How does this affect the broader crypto market?
      The liquidation event has created ripple effects across the cryptocurrency market, potentially leading to increased volatility in altcoins.
  • Ethereum Price Pattern Signals Massive $12,000 Rally Ahead

    Ethereum (ETH) is showing strong technical signals that point to an imminent breakout, with analysts projecting a potential surge to $12,000. This comprehensive analysis examines the key chart patterns and market indicators suggesting ETH’s next major move.

    Multi-Year Triangle Pattern Signals Bullish Breakout

    As Ethereum tests crucial resistance levels, technical analysis reveals a compelling setup. The second-largest cryptocurrency has formed a multi-year Symmetrical Triangle Pattern on the monthly timeframe, dating back to the 2021 bull market peak. This pattern typically signals trend continuation and could trigger a significant price movement.

    Key technical indicators include:

    • Current price consolidation at $2,606
    • Critical breakout level at $3,500
    • 5% increase in 24-hour trading volume
    • Formation of bullish momentum indicators

    Expert Analysis Points to Historic Price Targets

    Crypto analyst Captain Faibik has identified several crucial factors supporting the bullish case:

    Key Price Targets:

    • Initial breakout confirmation: $3,500
    • Primary target: $12,000
    • Extended target (Trader Tardigrade): $18,000
    • Secondary confirmation level: $15,000

    Impulsive Wave Analysis Suggests Higher Moves

    Technical indicators are aligning with historical patterns, suggesting ETH has entered an impulsive wave zone similar to the 2021 bull run. This technical setup historically precedes significant price appreciation.

    SPONSORED

    Trade Ethereum with up to 100x leverage on perpetual contracts

    Trade Now on Defx

    FAQs About Ethereum’s Price Outlook

    Q: What is the key breakout level for Ethereum?
    A: Analysts identify $3,500 as the critical monthly close needed to confirm the bullish breakout.

    Q: When could the breakout occur?
    A: Technical analysis suggests the breakout could happen within the next 1-2 months.

    Q: What are the risk factors?
    A: Traders should monitor overall market conditions and maintain proper risk management despite bullish signals.

    Market Implications and Trading Strategy

    For traders and investors, the current setup presents a strategic opportunity. The formation of the multi-year triangle pattern, combined with increasing trading volume and bullish momentum indicators, suggests accumulation at current levels could be advantageous.

    Continue monitoring key support and resistance levels while maintaining appropriate position sizing and risk management strategies.

  • Dogecoin Open Interest Drops 35% to $2B: Bullish Reversal Ahead?

    The cryptocurrency market is closely monitoring Dogecoin’s derivatives landscape as open interest metrics reveal significant shifts in trader sentiment. Recent data shows DOGE’s open interest averaging $2 billion in June, marking a substantial 35% decline from May’s peak levels.

    Understanding Dogecoin’s Current Market Position

    According to Coinglass data, Dogecoin’s open interest has experienced a notable decline from its May 11 peak of $3.07 billion, coinciding with DOGE’s recent price struggles below the $0.20 mark. This significant drop in open interest suggests a shift in market dynamics that could have important implications for future price action.

    SPONSORED

    Trade Dogecoin with up to 100x leverage on perpetual contracts

    Trade Now on Defx

    Technical Analysis Points to Potential Reversal

    Despite the bearish open interest data, several technical indicators suggest a potential trend reversal:

    • RSI showing higher lows while price tests previous support
    • 0.618 Fibonacci retracement level providing strong support
    • Formation of a falling wedge pattern, typically a bullish reversal signal

    Expert Price Predictions and Analysis

    Crypto analyst BitMonty projects a potential rally to $0.26420, citing the confluence of technical factors. Meanwhile, Trader Tardigrade’s long-term analysis suggests even more ambitious targets, with projections reaching $30 by 2029, though such predictions should be approached with appropriate skepticism.

    Market Context and Historical Perspective

    The current open interest levels, while lower than May’s peak, remain higher than the March-April averages when Trump tariffs impacted crypto markets. This historical context suggests underlying market resilience despite recent price weakness.

    FAQ Section

    What does declining open interest mean for Dogecoin?

    Declining open interest typically indicates reduced trading activity and can signal potential trend reversals when combined with price action analysis.

    Could Dogecoin recover to previous highs?

    Technical analysts suggest potential short-term recovery to $0.26, though longer-term projections remain highly speculative.

    What factors could trigger a bullish reversal?

    Key catalysts include technical pattern completions, increased institutional interest, and broader crypto market recovery.

    At time of writing, DOGE trades at $0.18, representing a 3% decline over 24 hours. Traders should maintain careful position sizing and risk management given the current market volatility.

  • PEPE Price Breakout: Technical Analysis Points to Major Rally Ahead

    PEPE Price Breakout: Technical Analysis Points to Major Rally Ahead

    The popular meme coin PEPE is showing strong bullish momentum after successfully breaking above a key resistance level, setting up what could be its next significant price advance. Technical analysts are closely watching this development as it could signal a broader shift in market sentiment for the token.

    Technical Breakout Confirms Bullish Structure

    According to respected crypto analyst UniChartz, PEPE has demonstrated remarkable strength by cleanly breaking through a critical resistance zone. This technical achievement is particularly noteworthy as it comes during a period of broader market uncertainty, similar to what we’ve seen with Dogecoin’s critical price levels.

    The breakout is currently undergoing a retest of the previous resistance level, which is now acting as support – a classic technical pattern that often precedes continued upward movement. This price action is being supported by multiple technical factors:

    • A well-established rising trendline providing dynamic support
    • Multiple successful tests of the support level
    • Strong confluence between horizontal and diagonal support zones
    • Increasing trading volume supporting the breakout

    Volume Analysis Supports Bullish Thesis

    Perhaps most significantly, trading volume metrics are lending credibility to this technical setup. Whales_Crypto_Trading has highlighted that PEPE’s breakout from its descending channel was accompanied by notably high volume – a key indicator that large market participants may be accumulating positions.

    SPONSORED

    Trade meme coins like PEPE with up to 100x leverage on perpetual contracts

    Trade Now on Defx

    Key Levels to Watch

    For traders looking to capitalize on this setup, several critical price levels deserve attention:

    • Current Support: The breakout retest zone
    • Rising Trendline: Providing dynamic support
    • Volume Profile: Shows significant buyer interest at current levels

    Frequently Asked Questions

    What makes this PEPE breakout significant?

    This breakout is particularly notable because it combines multiple technical factors: strong volume, clear support levels, and a well-defined trend structure.

    What could invalidate this bullish setup?

    A decisive break below the current support zone and rising trendline would likely invalidate the bullish thesis.

    How does this compare to previous PEPE rallies?

    The current setup shows stronger technical foundations compared to previous moves, with better volume support and clearer price structure.

  • Solana Price Risks 12% Drop as Key Support Tests $152 Level

    Solana Price Risks 12% Drop as Key Support Tests $152 Level

    Solana (SOL) faces mounting bearish pressure as the cryptocurrency tests critical support at $152, with technical analysis suggesting a potential 12% decline to $142. The broader crypto market cooldown has significantly impacted SOL’s momentum after its impressive performance earlier this year.

    Top crypto analyst Carl Runefelt has identified a concerning bear flag pattern forming around SOL’s horizontal support zone. This technical formation, combined with weakening market fundamentals, points to increased downside risk in the near term. As Bitcoin’s recent 9% decline to $105,000 continues to pressure the broader altcoin market, Solana traders are closely monitoring key support levels.

    SPONSORED

    Trade Solana with up to 100x leverage on perpetual contracts

    Trade Now on Defx

    Technical Analysis Points to Further Downside

    The 4-hour chart reveals a clear deterioration in SOL’s technical structure:

    • Current price: $152.62
    • Critical support zone: $150-152
    • Key resistance: $160
    • Bearish target: $142
    • All major moving averages trending below price

    The recent rejection from the $176-180 area has established a series of lower highs and lower lows, confirming the bearish momentum. Volume analysis shows increasing selling pressure as price approaches support, suggesting further downside potential.

    Macro Factors Weighing on Sentiment

    Several macro factors are contributing to the current market uncertainty:

    • US-China trade tensions
    • Rising bond yields
    • Global market volatility
    • Crypto market correlation with traditional risk assets

    Despite these short-term headwinds, institutional interest in Solana remains strong, with over $1 billion in recent institutional inflows suggesting long-term confidence in the network’s fundamentals.

    Key Levels to Watch

    Traders should monitor these critical price levels:

    Level Significance
    $160 Major resistance
    $152 Current support
    $142 Bear flag target

    FAQ

    Q: What could invalidate the bearish setup?
    A: A decisive break above $160 would invalidate the bear flag pattern and potentially trigger a bullish reversal.

    Q: How low could SOL go if support fails?
    A: The technical target of the bear flag pattern suggests a move to $142, representing a 12% decline from current levels.

    Q: What are the key indicators to watch?
    A: Monitor the 34 EMA ($157.70), 50 SMA ($159.82), and volume patterns for confirmation of price direction.

  • Bitcoin Price Eyes $99K Support After Sharp Rejection at $106K

    Bitcoin Price Eyes $99K Support After Sharp Rejection at $106K

    Bitcoin’s price trajectory is showing signs of a potential correction, with technical analysis pointing to a crucial support test at $99,000. As recent price action below $105,000 confirms growing bearish pressure, traders are closely monitoring key support levels that could determine BTC’s next major move.

    Technical Analysis Points to Short-Term Bearish Pressure

    According to respected TradingView analyst MelikaTrader94, Bitcoin is displaying clear signs of weakening momentum after reaching its recent all-time high of $112,000. The formation of a descending trendline on the 4-hour chart has become a significant resistance barrier, with multiple rejections suggesting bears are gaining control of short-term price action.

    SPONSORED

    Trade Bitcoin with up to 100x leverage on perpetual contracts

    Trade Now on Defx

    Critical Support Levels to Watch

    Currently trading at $106,432, Bitcoin faces immediate resistance at the descending trendline. A rejection here could trigger a correction toward the psychological $99,000 support level. This potential pullback aligns with recent whale accumulation patterns, suggesting large investors may be preparing to buy the dip.

    Bullish Case Remains Strong Despite Short-Term Weakness

    While the immediate outlook appears bearish, the larger technical structure remains bullish. A successful test of the $99,000 support could set up Bitcoin for its next major rally, with potential targets extending beyond $114,000. This scenario is supported by on-chain metrics showing decreased liquid supply, which historically precedes significant price appreciation.

    Key Factors for Traders

    • Current resistance: $106,500 descending trendline
    • Critical support: $99,000
    • Volume profile: Decreasing on rallies
    • RSI: Showing bearish divergence on 4H timeframe

    FAQ Section

    What’s causing Bitcoin’s current price weakness?

    Technical exhaustion after reaching all-time highs, combined with profit-taking and decreasing buy-side pressure, has created short-term bearish conditions.

    Could Bitcoin fall below $99,000?

    While possible, strong institutional buying interest and technical support make this level likely to hold as a bottom for any correction.

    What’s the timeline for potential recovery?

    Based on historical patterns, consolidation periods typically last 1-2 weeks before a decisive move occurs.

  • Ethereum Price Pattern Mirrors Bitcoin’s 2020 Breakout – 15% Rally Ahead?

    Ethereum Price Pattern Mirrors Bitcoin’s 2020 Breakout – 15% Rally Ahead?

    Ethereum (ETH) is showing remarkable strength above $2,500, with technical patterns suggesting a potential major breakout ahead. Recent analysis indicates a possible 15% surge if key resistance levels are breached, mirroring Bitcoin’s historic 2020 price action that preceded its legendary bull run.

    Technical Analysis Points to Historic Pattern Repeat

    According to prominent analyst Ted Pillows, Ethereum has printed four consecutive two-week green candles since bottoming, creating a formation strikingly similar to Bitcoin’s structure following the March 2020 crash. That pattern preceded BTC’s eventual surge to $69,000, raising speculation about ETH’s potential to follow a similar trajectory.

    SPONSORED

    Trade Ethereum with up to 100x leverage on perpetual contracts

    Trade Now on Defx

    Key Price Levels and Market Structure

    ETH currently consolidates above $2,600, maintaining strength despite global macro headwinds. The critical support zone lies between $2,590-$2,600, with the 50-period SMA providing additional technical backing. A breakthrough above $2,680 could trigger acceleration toward $2,800 and beyond.

    Macro Factors and Market Sentiment

    While concerns about US dollar stability persist, Ethereum continues to attract institutional interest. The combination of technical strength and fundamental developments suggests growing confidence in ETH’s long-term prospects.

    FAQ Section

    What makes the current Ethereum pattern similar to Bitcoin’s 2020 setup?

    The four consecutive two-week green candles and similar market structure following a bottom formation mirror Bitcoin’s pattern before its major breakout.

    What are the key resistance levels to watch?

    The immediate resistance lies at $2,680, with $2,800 serving as the next major target. Breaking these levels could trigger significant upside momentum.

    What could prevent Ethereum from following Bitcoin’s 2020 trajectory?

    Macro risks, including US Treasury yields and global trade tensions, could impact crypto market sentiment and prevent a similar breakout scenario.

  • Dogecoin Price Crashes Below $0.20: Technical Analysis Reveals Next Moves

    Dogecoin Price Crashes Below $0.20: Technical Analysis Reveals Next Moves

    The cryptocurrency market witnessed a significant development as Dogecoin (DOGE) experienced a notable price decline, breaking below the crucial $0.20 support level following Bitcoin’s retreat from $104,000. This technical analysis deep-dive examines the key factors behind this movement and what traders can expect next.

    Understanding the Recent DOGE Price Action

    As previously predicted by analysts tracking critical triangle patterns, Dogecoin’s price structure has shown signs of weakness. Crypto analyst Smart Flows from TradingView has identified a crucial 4-hour order block (OB) development that explains the recent price action.

    Technical Breakdown of the Liquidity Sweep

    The price movement can be broken down into several key components:

    • Initial support break at $0.22 price level
    • Liquidity sweep through the Fair Value Gap (FVG)
    • Break of psychological $0.20 support
    • Reset of market sentiment indicators

    SPONSORED

    Trade DOGE with up to 100x leverage on perpetual contracts

    Trade Now on Defx

    Critical Price Levels to Watch

    Traders should focus on these key price levels:

    • Primary resistance: $0.20928 (key reaction point)
    • Secondary resistance: $0.22094 (4-Hour order block)
    • Support level: $0.18000
    • Critical support: $0.16387 (deeper 4H OB)

    Potential Scenarios and Trading Implications

    Two primary scenarios are emerging:

    Bullish Case

    A successful clearance of the FVG above $0.20 could trigger a continuation pattern, potentially leading to a retest of the $0.22 level. This scenario aligns with broader market recovery expectations.

    Bearish Case

    Early rejection at current levels could signal distribution, potentially leading to a sweep below $0.18 and a retest of deeper support at $0.16387.

    FAQ Section

    What caused Dogecoin’s price to drop below $0.20?

    The drop was primarily triggered by Bitcoin’s price decline below $104,000 and a technical liquidity sweep through key support levels.

    Is this a good time to buy Dogecoin?

    Traders should wait for confirmation of support at current levels and watch for a clear break above $0.209 before considering long positions.

    What are the key support levels to watch?

    The primary support zones are at $0.18 and $0.16387, with the latter representing a crucial demand zone.

    As the market continues to digest this price action, traders should maintain strict risk management and watch for clear confirmations before taking positions. The next few days will be crucial in determining whether Dogecoin can maintain its structural integrity above key support levels.

  • Bitcoin Short Liquidations Surge 11.5% – Bullish Signal or Market Top?

    Bitcoin Short Liquidations Surge 11.5% – Bullish Signal or Market Top?

    Recent data reveals Bitcoin short liquidations have significantly outpaced long positions, raising questions about market direction as BTC trades near $104,800. This analysis explores whether the current liquidation pattern signals continued upside or warns of an impending correction.

    Bitcoin Liquidation Metrics Show Bearish Bets Getting Crushed

    According to data from CryptoQuant, the Bitcoin liquidation dominance oscillator has entered negative territory at -11.5%, indicating a clear dominance of short position liquidations. This trend aligns with recent whale accumulation patterns that have supported BTC’s upward momentum.

    SPONSORED

    Maximize your trading potential with up to 100x leverage on perpetual contracts

    Trade Now on Defx

    Historical Context: Short Liquidation Patterns

    The current -11.5% reading sits well below previous market tops:

    • December 2024: -16.5%
    • April 2024: -19%
    • January 2023: -24%

    This suggests the market hasn’t reached the extreme levels typically associated with local tops, despite Bitcoin trading near $104,800. The moderate reading aligns with recent on-chain metrics indicating sustained bull market strength.

    Institutional Activity Provides Additional Context

    Glassnode’s analysis of Unspent Realized Price Distribution (URPD) reveals significant institutional positioning:

    • Large holders (100-10k BTC) dominate activity above $90,000
    • Mega-whales (>100k BTC) concentrated at $74k-76k
    • Institutional whales (10k-100k BTC) active at $78k-79k, $85k-90k, and current levels

    Market Implications and Trading Outlook

    The current liquidation pattern suggests continued bullish momentum without overheating signals. Key factors supporting this view:

    • Moderate short liquidation levels compared to historical tops
    • Strong institutional positioning at key price levels
    • Absence of extreme leverage indicators

    FAQ Section

    What does the liquidation oscillator indicate?

    The liquidation oscillator measures the balance between long and short liquidations, with negative values indicating more short positions being liquidated than longs.

    Is the current market overheated?

    With the oscillator at -11.5%, current levels suggest healthy market conditions without the extreme readings (-16% to -24%) typically associated with market tops.

    What role are institutions playing?

    On-chain data shows significant institutional accumulation between $74k-90k, providing strong support levels below current prices.

  • Ethereum Price Eyes 15% Breakout as $2,680 Resistance Tests Bulls

    Ethereum Price Eyes 15% Breakout as $2,680 Resistance Tests Bulls

    Ethereum (ETH) is showing strong technical formation as it retests a crucial resistance level at $2,680, with multiple analysts projecting a potential 15% breakout in the coming days. Recent ETH/BTC consolidation patterns further support this bullish outlook.

    Technical Analysis Shows Bullish Pattern Formation

    Since early May, ETH has established a clear trading range between $2,475-$2,680, with the upper boundary proving to be a stubborn resistance level. The cryptocurrency’s recent 3% daily recovery has brought it back to test this critical zone, currently trading at $2,632.

    Carl Runefelt from The Moon Show highlights that Ethereum is forming a textbook ascending triangle pattern, typically a bullish continuation formation. The pattern suggests a potential 15% move once resolved, which could send ETH toward the $3,100 level if broken to the upside.

    SPONSORED

    Trade ETH with up to 100x leverage and maximize your profit potential

    Trade Now on Defx

    Multiple Indicators Signal Imminent Breakout

    Supporting the bullish case, Crypto Bullet identifies similar patterns across multiple ETH charts. The ETH Dominance chart shows an ascending triangle in the 12H timeframe, while both ETH/BTC and ETH/USD pairs approach the upper boundary of their respective symmetrical patterns.

    Historical Bitcoin Comparison Adds Confidence

    Ted Pillows draws striking parallels between ETH’s current price action and Bitcoin’s 2020 performance. The formation of four consecutive 2-week candles since April 7 mirrors BTC’s movement after the March 2020 crash, suggesting potential for new all-time highs if the pattern continues.

    Key Support and Resistance Levels

    • Current Price: $2,632
    • Key Resistance: $2,680-$2,850
    • Critical Support: $2,300
    • Monthly Performance: +44.2%

    Frequently Asked Questions

    Q: What is the potential price target if Ethereum breaks resistance?
    A: Analysts project a move toward $3,100, representing approximately 15% upside from current levels.

    Q: What are the key support levels to watch?
    A: The primary support zone lies at $2,300, with intermediate support at $2,475.

    Q: How does this pattern compare to previous breakouts?
    A: The current formation resembles Bitcoin’s 2020 pattern that preceded its bull run to all-time highs.

    As Ethereum continues to test the $2,680 resistance level, multiple technical indicators and analyst projections suggest an imminent breakout. Traders should monitor the key resistance zone between $2,680-$2,850 for confirmation of the next major move.