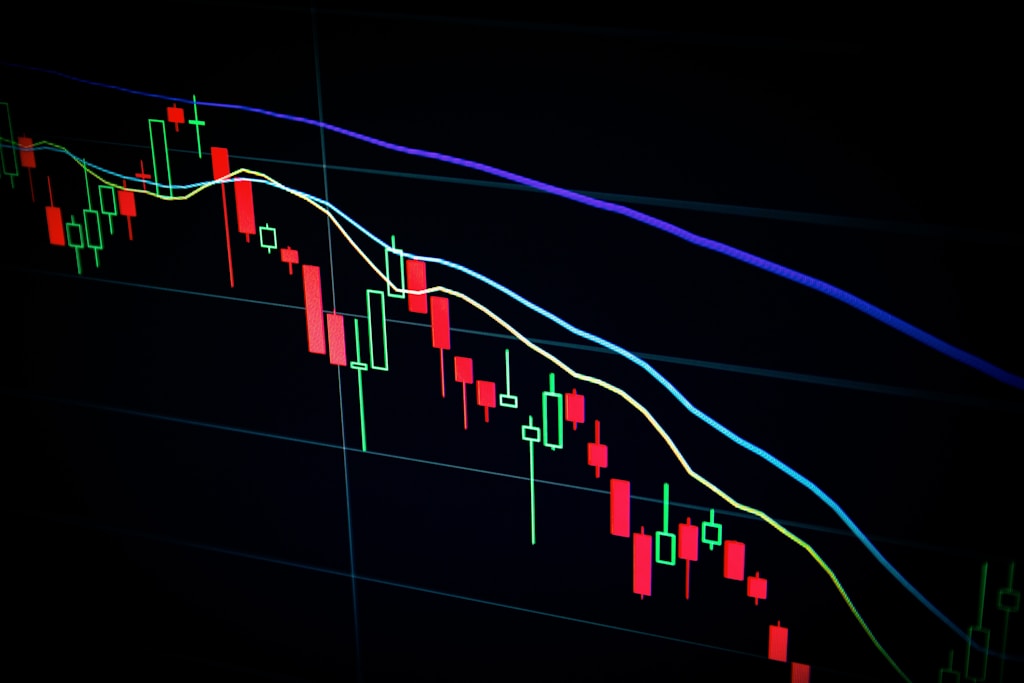
Tag: Trading Analysis

  • Bitcoin Price Crashes Below $75K as Short-Term Holders Face Pressure

    Bitcoin Price Crashes Below $75K as Short-Term Holders Face Pressure

    Bitcoin’s price has plunged below the critical $75,000 level amid growing concerns over global tariff disputes, with short-term holders showing signs of increasing pressure. Recent market volatility triggered by tariff fears has sent shockwaves through the crypto market, raising questions about potential capitulation.

    Market Analysis: Short-Term Holder Behavior Under Scrutiny

    According to CryptoQuant analyst Yonsei Dent, the STH-SOPR (Short-Term Holder Spent Output Profit Ratio) metric reveals crucial insights into current market dynamics. This key indicator measures whether recent buyers are selling at a profit or loss, with readings below 1.0 signaling potential capitulation events.

    Despite Bitcoin’s significant decline of over 10% in the past two weeks, the STH-SOPR remains notably resilient compared to previous correction events in 2024. The formation of a death cross at $76K adds technical significance to the current price action.

    SPONSORED

    Trade Bitcoin with up to 100x leverage and maximize your profit potential

    Trade Now on Defx

    Key Support Levels and Technical Outlook

    The $78,000 level has emerged as a crucial support zone, with market participants closely monitoring this threshold for signs of stabilization. Technical analyst Merlijn The Trader suggests the current price range represents a “green zone” – historically significant accumulation levels reminiscent of 2015, 2019, and 2020 buying opportunities.

    Frequently Asked Questions

    What is causing Bitcoin’s current price decline?

    The primary factors include global tariff disputes, broader market uncertainty, and potential short-term holder capitulation.

    What is the STH-SOPR indicator showing?

    The STH-SOPR remains above extreme capitulation levels, suggesting that while pressure exists, widespread panic selling hasn’t materialized.

    What are the key support levels to watch?

    The critical support zone lies at $78,000, with secondary support at $75,000.

  • Solana Price Crashes 21% to $98: Critical Support Levels Under Threat

    Solana Price Crashes 21% to $98: Critical Support Levels Under Threat

    Solana (SOL) has plunged into dangerous territory, recording a dramatic 21% price crash to $98.09 in what appears to be part of a broader cryptocurrency market downturn that has triggered massive liquidations. The sharp decline has shattered critical support levels and sparked fears of further capitulation among investors.

    Market Analysis: Understanding the SOL Price Crash

    The severity of today’s selloff is highlighted by SOL’s volatile trading range, swinging between $120.07 and $98.06. This price action has effectively erased several weeks of gains and pushed Solana’s market capitalization down to $51.15 billion. The high trading volume of $5.17 billion suggests significant selling pressure and potential institutional repositioning.

    SPONSORED

    Trade Solana with up to 100x leverage on perpetual contracts

    Trade Now on Defx

    Technical Analysis: Key Support Levels

    The breach of the psychologically important $100 mark represents a significant technical breakdown. This level had previously served as strong support during recent corrections. With this support now broken, traders are eyeing these critical levels:

    • Immediate Support: $98.00
    • Secondary Support: $79.25
    • Last Line of Defense: $58.25

    Market Context and Broader Implications

    This dramatic decline isn’t occurring in isolation. The entire crypto market is experiencing significant turbulence, with liquidations exceeding $900 million. The selloff appears to be driven by a combination of factors:

    • Technical breakdown below key moving averages
    • Increased selling pressure from large holders
    • Broader market risk-off sentiment
    • Macroeconomic uncertainties

    Recovery Scenarios and Risk Assessment

    For Solana to regain bullish momentum, several key conditions must be met:

    1. Reclaim and hold above $100
    2. Establish support at current levels
    3. Show significant buying volume
    4. Maintain network fundamentals

    Expert Outlook and Trading Considerations

    Market analysts suggest that while the current situation is concerning, it may present opportunities for strategic positioning. Traders should consider:

    • Setting stop losses below key support levels
    • Watching for volume confirmation of any rebounds
    • Monitoring broader market correlation
    • Following institutional flow indicators

    FAQ Section

    What caused Solana’s price to crash?

    The crash appears to be part of a broader market correction, influenced by technical breakdowns and increased selling pressure across the cryptocurrency market.

    Will Solana recover from this drop?

    Recovery potential depends on multiple factors, including broader market conditions and the ability to reclaim key support levels, particularly the $100 mark.

    What are the next support levels for SOL?

    Key support levels to watch are $79.25 and $58.25, which could provide stabilization points if current levels fail to hold.

  • Bitcoin Price Crashes 10% to $75K as Trump Tariffs Rock Markets

    Bitcoin Price Crashes 10% to $75K as Trump Tariffs Rock Markets

    Bitcoin (BTC) plunged below the critical $75,000 support level on Monday as global markets reeled from President Trump’s aggressive new tariff policies. The leading cryptocurrency dropped 10% in 24 hours amid a broader market selloff that saw Asian stocks experience their worst decline since the 1997 financial crisis.

    The dramatic market moves come as Trump’s announcement of sweeping new tariffs triggered a wave of panic selling across all asset classes. Hong Kong’s Hang Seng index crashed 14%, while major cryptocurrencies faced severe pressure.

    Market Impact Breakdown

    • Bitcoin (BTC): Down 10% to $75,000
    • Ethereum (ETH): Plunged 22% to $1,514
    • XRP: Crashed over 20%
    • Solana (SOL): Dropped more than 20%
    • Bitcoin Dominance: Rose to 63%, highest since 2021

    SPONSORED

    Navigate volatile markets with up to 100x leverage on perpetual contracts

    Trade Now on Defx

    Global Market Turmoil

    The selloff intensified after China announced retaliatory 34% tariffs on all U.S. goods. Traditional safe-haven assets like U.S. Treasury bonds saw increased demand, with the 10-year yield dropping 3 basis points to 4%.

    Expert Analysis

    Bill Ackman urged for a 90-day pause on tariffs to prevent what he called a “self-induced economic nuclear winter.” Meanwhile, Goldman Sachs raised its recession probability to 45% and brought forward its Fed rate cut expectations.

    What’s Next for Bitcoin?

    Key support levels to watch:

    • $72,000: Previous resistance turned support
    • $70,000: Psychological level
    • $65,000: 2021 all-time high

    FAQ

    Q: Why is Bitcoin falling with stocks?
    A: The correlation between Bitcoin and traditional markets often increases during periods of macro uncertainty and risk-off sentiment.

    Q: Could this trigger a crypto bear market?
    A: While significant, Bitcoin’s 63% market dominance suggests potential rotation rather than complete market exodus.

    Q: What are the key levels to watch?
    A: The $70,000 psychological level and previous ATH at $65,000 represent crucial support zones.

  • Crypto Market Crash: XRP and SOL Plunge 14% as $800M Liquidated

    Crypto Market Crash: XRP and SOL Plunge 14% as $800M Liquidated

    Crypto Market Crash: XRP and SOL Plunge 14% as $800M Liquidated

    The cryptocurrency market experienced a significant downturn as XRP and Solana (SOL) led major altcoins in a steep decline, resulting in over $840 million in long liquidations within 24 hours. This market-wide correction comes amid growing concerns over potential market impacts from Trump’s proposed tariffs.

    Key Market Movements

    • Bitcoin (BTC) dropped below $77,000
    • Ethereum (ETH) declined 15% to $1,500
    • XRP and SOL both fell approximately 14%
    • Total liquidations exceeded $840 million

    Liquidation Analysis

    According to CoinGlass data, the breakdown of liquidations shows:

    • Bitcoin traders lost over $322 million
    • Ethereum positions saw $290 million in liquidations
    • XRP and SOL futures recorded an unusual $80 million in combined liquidations

    SPONSORED

    Trade with confidence using up to 100x leverage on perpetual contracts

    Trade Now on Defx

    Market Sentiment Analysis

    The massive liquidation event reveals that 86% of futures positions were bullish, indicating significant market overconfidence. This aligns with recent market analysis showing growing concerns about overvaluation.

    Global Market Context

    The crypto market downturn coincides with broader market uncertainty, as U.S. stock futures declined 5% following renewed trade war concerns. This correlation suggests increasing integration between traditional and crypto markets.

    FAQ Section

    What caused the crypto market crash?

    The crash appears to be triggered by a combination of overleveraged positions and broader market concerns about Trump’s proposed tariffs affecting global markets.

    Will crypto prices recover soon?

    While historical patterns suggest potential recovery, current market conditions and global economic uncertainties make immediate recovery uncertain.

    What should traders do during this market correction?

    Risk management and position sizing become crucial during volatile periods. Traders should consider reducing leverage and maintaining adequate collateral.

  • Bitcoin Price Drops 3% to $78.6K: Market Shows Signs of Cooling

    Bitcoin Price Drops 3% to $78.6K: Market Shows Signs of Cooling

    Key Takeaways:

    • Bitcoin (BTC) price declined to $78,639 on Sunday afternoon
    • The drop continues the morning’s downward trend ahead of Monday’s Wall Street opening
    • Trading volume patterns suggest potential market consolidation phase

    In a significant market movement on Sunday, April 6, 2025, Bitcoin (BTC) experienced a notable decline, dropping to $78,639 by 3 p.m. ET. This price action follows recent tests of the $81K support level, suggesting a potential shift in market sentiment.

    The latest price movement represents approximately a 3% decrease from recent highs, indicating that the market may be entering a consolidation phase after the remarkable bull run of early 2025.

    SPONSORED

    Maximize your trading potential during market volatility

    Trade Now on Defx with 100x Leverage

    Market Analysis and Technical Outlook

    The current price action aligns with typical weekend trading patterns, where lower liquidity can lead to increased volatility. As Wall Street prepares to reopen on Monday, traders should monitor key support levels around $78,000.

    Expert Insights

    Market analysts suggest this pullback could be healthy for Bitcoin’s long-term trajectory. As noted in our recent coverage of Bitcoin’s potential new ATH by Q1 2026, temporary retracements are common during extended bull markets.

    FAQs

    • Is this price drop significant for Bitcoin’s long-term outlook?
      Most analysts view this as a normal market correction rather than a trend reversal.
    • How does this compare to previous weekend trading patterns?
      Weekend volatility is common in crypto markets due to lower trading volumes.
  • XRP Network Activity Surges 490%: Major Price Rally Ahead?

    XRP Network Activity Surges 490%: Major Price Rally Ahead?

    XRP’s network metrics are flashing strong bullish signals as active addresses surge by a remarkable 490% since the 2022 market cycle low, potentially setting the stage for significant price appreciation. This explosive growth in network activity suggests mounting retail interest that could fuel XRP’s next major move.

    XRP Network Activity Hits Multi-Year High

    According to recent data from Glassnode, XRP has emerged as a retail favorite in the current market cycle, with network participation reaching levels not seen since the 2017 bull run. This surge in activity stands in stark contrast to Bitcoin’s more modest 10% increase in active addresses over the same period.

    The dramatic increase in network engagement comes as Coinbase prepares to launch XRP futures trading, potentially adding significant liquidity to the XRP ecosystem.

    SPONSORED

    Trade XRP with up to 100x leverage on perpetual contracts

    Trade Now on Defx

    Key Network Metrics Signal Growing Adoption

    • Active addresses up 490% since 2022 cycle low
    • Retail participation outpacing institutional involvement
    • Network growth surpassing Bitcoin’s 10% increase
    • Trading volume showing consistent upward trend

    Price Implications and Technical Analysis

    Technical analysis suggests XRP could be preparing for a significant move upward. Crypto analyst Javon Marks projects a potential 4,400% surge to $99, based on historical patterns and the current market structure. This forecast aligns with the breakout from a massive Pennant pattern, with initial resistance at $3.317.

    Frequently Asked Questions

    Why is XRP’s network activity increasing?

    The surge in active addresses indicates growing retail adoption and increased trading activity, potentially driven by positive market sentiment and regulatory clarity.

    What does this mean for XRP’s price?

    Historically, increases in network activity have preceded significant price movements. The current surge could signal an upcoming rally, though market conditions remain volatile.

    How does XRP’s growth compare to Bitcoin?

    XRP’s 490% increase in active addresses significantly outpaces Bitcoin’s 10% growth, suggesting stronger retail interest in XRP during this market cycle.

    Looking Ahead: XRP’s Market Outlook

    While past performance doesn’t guarantee future results, the combination of surging network activity, technical breakout patterns, and increasing institutional interest creates a compelling case for XRP’s potential upside. Investors should monitor key resistance levels and maintain appropriate risk management strategies.

  • Shiba Inu Price Analysis: SHIB Needs 600% Rally to Match DOGE Market Cap

    Shiba Inu Price Analysis: SHIB Needs 600% Rally to Match DOGE Market Cap

    The Shiba Inu (SHIB) market continues to face significant headwinds in 2025, with the popular meme coin trading at $0.00001269, a stark 85% below its all-time high of $0.00008845. A new analysis reveals that even if SHIB were to match Dogecoin’s current $25 billion market cap, it would still fall short of its previous peak.

    Market Cap Analysis: SHIB vs DOGE

    According to recent data from Marketcapof, if SHIB were to achieve DOGE’s current market capitalization of $25 billion, its price would reach approximately $0.00004256. While this represents a significant 235% increase from current levels, it would still leave SHIB roughly 52% below its historic high.

    SPONSORED

    Trade SHIB with up to 100x leverage and maximize your profit potential

    Trade Now on Defx

    Technical Analysis and Expert Predictions

    Crypto analyst Javon Marks presents a more optimistic outlook, suggesting SHIB could target $0.000081, representing a potential 400% rally. This analysis aligns with broader momentum in the meme coin sector, though significant hurdles remain.

    On-Chain Metrics Signal Caution

    Current on-chain metrics paint a concerning picture:

    • Burn rate down 94% in 24 hours (946,228 SHIB burned)
    • Weekly burns declined to 1 billion tokens
    • Large transactions decreased by 2%
    • 61% of holders currently at a loss

    FAQ: SHIB Price Potential

    Q: Can SHIB reach its previous all-time high in 2025?
    A: Based on current market conditions and required growth metrics, SHIB would need approximately 600% growth to reach its previous ATH.

    Q: What factors could drive SHIB price growth?
    A: Key catalysts include increased burn rate, whale accumulation, broader market recovery, and ecosystem development.

    Q: How does SHIB’s market structure compare to DOGE?
    A: SHIB’s larger supply means it requires significantly more capital inflow to achieve similar price movements to DOGE.

    Market Outlook and Trading Implications

    While SHIB shows potential for significant gains, investors should consider several risk factors:

    • High correlation with broader crypto market movements
    • Declining burn rate impact on supply dynamics
    • Whale activity showing reduced interest
    • Technical resistance levels at $0.000020 and $0.000035

    Time to read: 4 minutes

  • Bitcoin Price Eyes Q2 Rally: 2017 Pattern Signals Major Breakout

    Bitcoin Price Eyes Q2 Rally: 2017 Pattern Signals Major Breakout

    Bitcoin (BTC) appears poised for a significant Q2 rally as historical patterns from 2017 emerge, despite currently struggling to maintain the $84,000 level. Recent technical analysis suggests key support levels could determine the trajectory of this potential breakout.

    Current Market Dynamics

    Bitcoin’s recent price action has been marked by volatility, with the flagship cryptocurrency experiencing an 8.2% weekly decline to $81,278 before recovering. The crucial $84,000 resistance level continues to pose a significant challenge, having rejected multiple breakout attempts since the post-November range breakdown.

    SPONSORED

    Maximize your trading potential with up to 100x leverage on perpetual contracts

    Trade Now on Defx

    2017 Pattern Comparison

    Analyst Ted Pillows has identified striking similarities between current market conditions and Bitcoin’s behavior during Q2 2017. During that period, BTC consolidated for the first two months before initiating a dramatic rally from $1,400 to $20,000 by December 2017.

    Technical Indicators and Market Structure

    The current consolidation phase is occurring between two critical EMAs – the 21-week and 50-week moving averages. Recent NVT ratio analysis suggests caution, though historical Q2 performance data remains predominantly bullish.

    Price Targets and Support Levels

    Key levels to watch include:

    • Immediate resistance: $84,000-$85,000
    • Current support: $81,278
    • Re-accumulation target: $93,500

    FAQ Section

    Why is the Q2 comparison to 2017 significant?

    The 2017 pattern showed similar consolidation before a major breakout, leading to Bitcoin’s previous bull run.

    What are the key resistance levels to watch?

    The primary resistance zone lies between $84,000-$85,000, with secondary resistance at $88,000-$89,000.

    Could Bitcoin reach new all-time highs in 2025?

    Historical patterns and current market dynamics suggest potential for new highs, though careful risk management remains essential.

  • Bitcoin RSI Pattern Signals Major Price Move as $84K Support Tests

    Bitcoin’s Relative Strength Index (RSI) is showing a critical pattern that could determine BTC’s next major price move, as the leading cryptocurrency tests key support levels around $84,000. Technical analyst Rekt Capital has identified striking similarities between current RSI readings and patterns that preceded Bitcoin’s rally to $100,000 in late 2024.

    Critical RSI Pattern Emerges as Bitcoin Tests Support

    According to Rekt Capital’s analysis shared on X (formerly Twitter), Bitcoin’s daily RSI is approaching a crucial retest of the downtrend line that dates back to November 2024. This technical development gains significance as recent PCE inflation data has sparked increased market volatility, pushing BTC below the $84,000 mark.

    SPONSORED

    Trade Bitcoin with up to 100x leverage on perpetual contracts

    Trade Now on Defx

    Market Implications and Technical Analysis

    The RSI indicator currently sits at a critical 40 level, with analysts closely watching for either a breakdown or successful support test. A break below could trigger renewed selling pressure, while holding above may signal continuation of the broader uptrend that took Bitcoin to new highs following Trump’s election victory.

    Macro Factors Weighing on Bitcoin

    Several macro developments are influencing Bitcoin’s price action:

    • Trump’s new tariff policies creating market uncertainty
    • Federal Reserve’s quantitative tightening stance
    • Higher-than-expected PCE inflation readings

    Expert Price Predictions

    Multiple analysts have weighed in with varying predictions:

    • Titan of Crypto: Potential rally to $91,400 based on bullish pennant formation
    • Peter Brandt: Bearish outlook with possible drop to $65,635
    • QCP Capital: Limited short-term upside until trade policy clarity

    FAQ Section

    What is the significance of the RSI retest?

    The RSI retest of the November 2024 downtrend line could determine Bitcoin’s next major price movement, with the 40 level serving as a crucial support zone.

    How does the current market compare to November 2024?

    While similar RSI patterns are present, current macro headwinds including inflation concerns and policy uncertainty create a more challenging environment.

    What are the key support levels to watch?

    The monthly Tenkan and Fair Value Gap midline serve as critical support zones, with $84,000 acting as immediate psychological support.

    At time of writing, Bitcoin trades at $83,900, down 2% over 24 hours as markets digest the latest macro developments and technical signals.

  • Bitcoin Price Plunges Below $84K as Inflation Fears Grip Markets

    Bitcoin’s price took a significant hit on Friday, dropping to $83,544 amid growing inflation concerns and market turbulence triggered by Trump’s proposed pharmaceutical tariffs. This 4.14% decline highlights the increasing correlation between traditional markets and cryptocurrency valuations in 2025.

    Market Turbulence: A Perfect Storm

    The latest price action comes as inflation fears continue to dominate market sentiment, with March’s consumer sentiment data revealing the highest long-term inflation expectations in more than 30 years. This bearish pressure has been amplified by former President Trump’s announcement of potential tariffs on pharmaceutical companies, sending shockwaves through both traditional and crypto markets.

    Key Market Indicators

    • Bitcoin Price: $83,544 (⬇️ 4.14%)
    • 24-hour Trading Volume: $47.2B
    • Market Dominance: 51.2%
    • Total Crypto Market Cap Decline: -4.14%

    SPONSORED

    Navigate market volatility with up to 100x leverage on perpetual contracts

    Trade Now on Defx

    Technical Analysis and Market Outlook

    The current price action has established several critical support levels that traders should monitor:

    Support Level Price Point Significance
    Primary Support $82,500 Previous resistance turned support
    Secondary Support $80,000 Psychological level
    Critical Support $78,500 200-day moving average

    Impact of Macroeconomic Factors

    The correlation between Bitcoin and traditional markets has strengthened in 2025, with several factors contributing to the current downturn:

    • Rising inflation expectations
    • Proposed pharmaceutical tariffs
    • Global trade tensions
    • Stock market volatility

    Expert Insights

    Market analysts remain divided on Bitcoin’s short-term prospects. According to cryptocurrency strategist Michael van de Poppe, “The current pullback represents a healthy correction in an otherwise strong bull market. Key support at $82,500 needs to hold to maintain bullish momentum.”

    Frequently Asked Questions

    What caused Bitcoin’s price drop below $84K?

    The decline was primarily triggered by inflation fears and market turbulence following Trump’s proposed pharmaceutical tariffs, combined with bearish sentiment in traditional markets.

    Will Bitcoin recover from this dip?

    Technical indicators suggest strong support at $82,500, but market recovery will largely depend on broader economic conditions and inflation data in the coming weeks.

    How does this affect the overall crypto market?

    The total cryptocurrency market cap has declined by 4.14%, indicating a market-wide impact of the current bearish sentiment.

    This is a developing story. Stay tuned for updates as the market situation evolves.