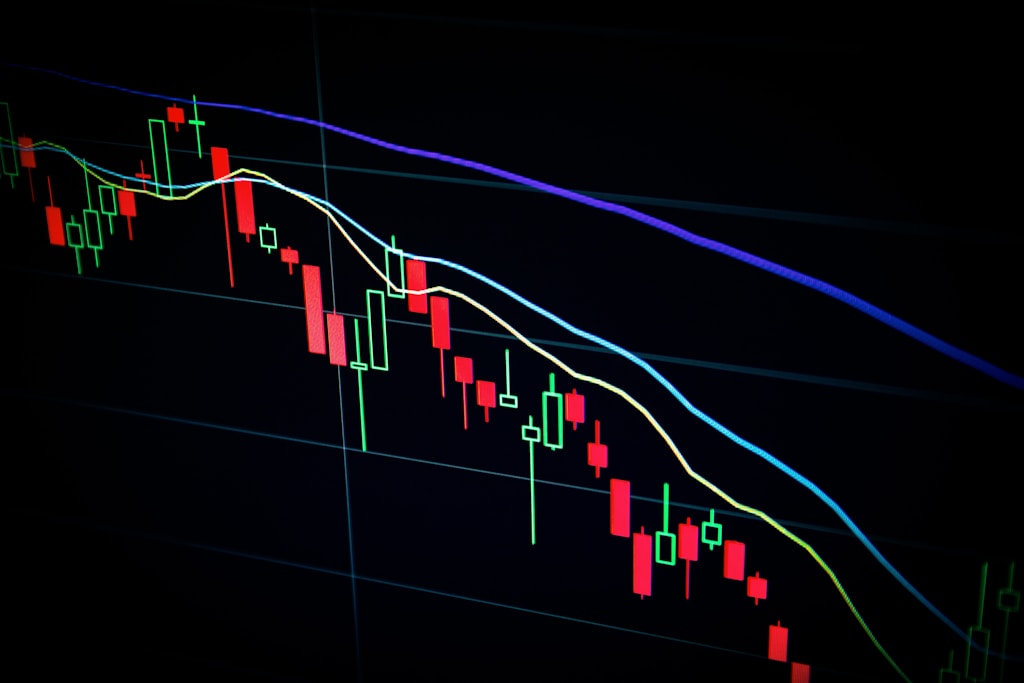
Tag: Trading Patterns

  • XRP Price Alert: Head & Shoulders Pattern Signals Potential Drop to $1.07

    XRP Price Alert: Head & Shoulders Pattern Signals Potential Drop to $1.07

    Leading cryptocurrency analyst Peter Brandt has identified a bearish head-and-shoulders pattern in XRP’s price action, suggesting a potential decline below the critical $2 support level. This technical analysis comes amid increased market volatility and growing concerns about XRP’s short-term trajectory.

    As recent price movements have shown, XRP has been experiencing significant pressure near its support levels, with technical indicators pointing to possible bearish momentum.

    Technical Analysis Reveals Bearish Pattern

    According to Brandt’s analysis shared on X (formerly Twitter), XRP is displaying a textbook head-and-shoulders formation, typically considered a bearish reversal pattern. The pattern projects a potential price decline to $1.07, representing a significant drop from current levels.

    SPONSORED

    Trade XRP with up to 100x leverage and maximize your profit potential

    Trade Now on Defx

    Key Support Levels to Watch

    Multiple analysts have weighed in on crucial support levels:

    • $2.25 – Current immediate support
    • $1.90 – Secondary support level
    • $1.54 – Potential breakdown target identified by CasiTrades
    • $1.07 – Ultimate bearish target according to Brandt

    Bullish Scenario and Invalidation Points

    Despite the bearish outlook, analyst Ali Martinez suggests that a break above $3 would invalidate the head-and-shoulders pattern, potentially triggering a bullish reversal. Additionally, Dark Defender maintains an optimistic long-term view, projecting potential targets as high as $23.20 through wave analysis.

    FAQ Section

    What is a head-and-shoulders pattern?

    A head-and-shoulders pattern is a technical chart formation consisting of three peaks, with the middle peak (head) being higher than the two outer peaks (shoulders). It’s typically considered a bearish reversal pattern.

    What could invalidate the bearish scenario?

    A decisive break above $3 would invalidate the bearish pattern and could trigger a bullish reversal.

    What’s the current XRP price?

    XRP is currently trading at $2.25, showing a 4% decline in the last 24 hours according to CoinMarketCap data.

  • XRP Price Alert: Head & Shoulders Pattern Signals Potential 54% Drop

    Veteran crypto analyst Peter Brandt has identified a bearish technical formation in XRP’s price chart that could signal a significant downturn ahead. In a detailed analysis shared on X (formerly Twitter), Brandt points to a classic Head & Shoulders (H&S) pattern that suggests XRP may retrace to the $1.07 level – a potential 54% decline from current prices.

    XRP’s Technical Setup: Breaking Down the Head & Shoulders Pattern

    The formation developed between October 2024 and March 2025, with XRP showing the following key price movements:

    • Left Shoulder: Formed near $2.90
    • Head: Peak at $3.40 in mid-January
    • Right Shoulder: Currently developing around $3.00
    • Neckline: Critical support at $1.90

    This technical structure aligns with recent XRP price analysis that highlighted key resistance levels, though offering a more bearish outlook.

    Critical Price Levels to Watch

    Traders should monitor two crucial price zones:

    • Support: $1.90 (neckline) – A break below could trigger the projected decline
    • Resistance: $2.90-$2.99 – Current ceiling where upward momentum has stalled

    SPONSORED

    Trade XRP with up to 100x leverage on perpetual contracts

    Trade Now on Defx

    Technical Indicators Support Bearish Outlook

    Additional technical metrics reinforce the bearish scenario:

    • Moving Averages: 8-day and 18-day MAs converge at $2.44, indicating muted momentum
    • ATR: 30-day reading at $0.205 shows compressed volatility
    • Volume: Trading activity has declined during pattern formation

    Expert Analysis and Price Targets

    Brandt emphasizes his neutral stance, stating: “I have no vested interest up or down. XRP is forming a textbook H&S pattern.” He outlines key trading levels:

    • Above $3.00: Not advisable to maintain short positions
    • Below $1.90: Suggests avoiding long positions
    • Target: $1.07 based on pattern measurement

    FAQ: XRP Head & Shoulders Pattern

    Q: What makes this H&S pattern significant?
    A: The pattern’s clear formation and textbook measurements, combined with declining volume, increase its reliability as a bearish indicator.

    Q: How long might the decline take?
    A: H&S patterns typically play out over several weeks to months, suggesting a gradual rather than sudden decline.

    Q: What could invalidate this bearish setup?
    A: A decisive break above $3.00 with strong volume would likely invalidate the pattern and potentially trigger a short squeeze.

    At press time, XRP trades at $2.35, maintaining a precarious position below key resistance levels as traders await confirmation of the pattern’s completion.

  • Dogecoin Price Signals 100% Rally Potential: Rounding Bottom Pattern Emerges

    Dogecoin (DOGE) appears to be setting up for a potentially explosive move, as technical analysis reveals a familiar bullish pattern that has historically preceded major rallies. According to prominent crypto analyst BasicTradingTV, the leading meme coin is displaying a textbook rounding bottom formation that could trigger a parabolic price surge.

    This analysis comes as Dogecoin recently broke above the crucial $0.18 level, establishing a foundation for potential further gains. The current technical setup bears striking similarities to previous bull cycles that resulted in significant price appreciation.

    Technical Analysis Points to Bullish Momentum

    The monthly chart reveals a clear rounding bottom pattern that has been developing since Dogecoin’s 2021 all-time high, through the 2022 bear market, and into the late 2024 recovery phase. This pattern is particularly significant as it mirrors previous formations that preceded major bull runs in DOGE’s history.

    SPONSORED

    Trade DOGE with up to 100x leverage on perpetual contracts

    Trade Now on Defx

    Critical Price Levels to Watch

    Two key price levels have emerged as crucial for Dogecoin’s next move:

    • Support: $0.15 – Must hold to maintain bullish momentum
    • Resistance: $0.50 – Breaking this level could confirm parabolic rally

    March Monthly Close: A Decisive Moment

    The upcoming March monthly close is particularly significant for Dogecoin’s trajectory. A close above the established support level would strongly validate the bullish thesis and potentially trigger the anticipated parabolic move. Currently trading at $0.2052, DOGE has shown remarkable resilience, posting a 10.8% gain in the last 24 hours.

    Historical Pattern Comparison

    The current market structure closely resembles the formation that preceded Dogecoin’s historic 2021 rally. Key similarities include:

    • Extended consolidation period
    • Clear rounding bottom pattern
    • Strong support level establishment
    • Increasing buy-side pressure

    Risk Factors to Consider

    While the technical setup appears promising, investors should consider several risk factors:

    • Potential false breakout scenarios
    • Overall market correlation with Bitcoin
    • Historical resistance levels
    • Market sentiment shifts

    Frequently Asked Questions

    What is a rounding bottom pattern?

    A rounding bottom is a technical chart pattern that signals a potential reversal from a downtrend to an uptrend, characterized by a U-shaped price movement over time.

    What could invalidate this bullish scenario?

    A monthly close below the $0.15 support level would significantly weaken the bullish case and potentially signal a trend reversal.

    How long might this rally take to materialize?

    Based on historical patterns, parabolic moves typically unfold over 2-3 months once confirmed by a break above key resistance levels.

  • Bitcoin Forms Bullish Falling Wedge: $109K Target Within 10 Days

    Bitcoin’s price action is showing a critical technical formation that could signal an imminent breakout, according to leading crypto analysts. Recent cyclical analysis suggesting a $108K peak adds weight to this developing pattern.

    Bitcoin’s Falling Wedge Pattern Signals Potential Reversal

    Despite hitting an all-time high of $109,000 earlier this year, Bitcoin has experienced significant bearish pressure, dropping to $76,000. However, a clear falling wedge pattern has emerged over the past four months, traditionally a bullish reversal signal that could indicate major upside ahead.

    SPONSORED

    Trade Bitcoin with up to 100x leverage on perpetual contracts

    Trade Now on Defx

    Technical Analysis Points to $109K Target

    Renowned crypto analyst Captain Faibik has identified key technical factors supporting the bullish case:

    • Four-month falling wedge formation on daily timeframe
    • Potential retest of $80,000 before breakout
    • RSI reading above 52 indicating building bullish momentum
    • Bollinger Bands showing price approaching upper resistance at $90,343

    Key Price Levels to Watch

    Traders should monitor these critical price zones:

    Level Significance
    $90,343 Upper Bollinger Band resistance
    $84,565 Mid Bollinger Band support
    $78,788 Lower Bollinger Band support

    FAQ: Bitcoin’s Falling Wedge Pattern

    What is a falling wedge pattern?

    A falling wedge is a bullish technical pattern formed by two converging downward trendlines, typically signaling a potential price reversal.

    How reliable is this pattern?

    Falling wedge patterns have a 68% success rate in crypto markets when accompanied by supporting indicators like RSI and volume.

    What’s the expected timeframe for breakout?

    According to Captain Faibik’s analysis, the breakout could occur within the next 10 days.

    Time to read: 4 minutes

  • Bitcoin Price Stalls at $84K: Cup and Handle Pattern Signals $115K Target

    Bitcoin Price Stalls at $84K: Cup and Handle Pattern Signals $115K Target

    Bitcoin’s price action has entered a critical phase as the leading cryptocurrency consolidates around $84,000, following a technical pattern that suggests potential for significant upside. Recent analysis of Bitcoin’s bullish wedge pattern aligns with the current cup and handle formation, potentially setting up for a major move in Q2 2025.

    Bitcoin’s Technical Setup: Understanding the Cup and Handle Pattern

    According to renowned crypto analyst Ali Martinez, Bitcoin has completed a classic cup-and-handle formation with a peak near $109,000. This technical pattern typically signals continuation of the broader uptrend, with the current price action representing a crucial consolidation phase before the next potential leg up.

    Key levels to watch:

    • Current Price: $84,100
    • Immediate Resistance: $87,300
    • Pattern Target: $115,000
    • Critical Support: $81,000

    Market Context and Trading Volume Analysis

    The broader market context shows Bitcoin attempting to recover from a 29% correction since its January all-time high. Market sentiment has reached a 6-month low, creating a potential springboard for a strong recovery if key technical levels are reclaimed.

    SPONSORED

    Trade Bitcoin with up to 100x leverage on perpetual contracts

    Trade Now on Defx

    Technical Indicators and Price Targets

    The 4-hour timeframe shows critical technical confluence at $87,300, where both the 200-day MA and EMA intersect. A breakthrough above this level could trigger renewed momentum toward the psychological $90,000 barrier.

    FAQ: Bitcoin Cup and Handle Pattern

    Q: What is a cup and handle pattern?
    A: It’s a bullish continuation pattern resembling a cup with a handle, typically signaling the end of a consolidation period.

    Q: What’s the success rate of cup and handle patterns?
    A: Historical data shows approximately 65% success rate when properly formed in crypto markets.

    Q: How long does it take for the pattern to complete?
    A: Typically 7-65 weeks, with the current formation taking about 12 weeks to develop.

    Looking Ahead: Key Price Levels to Watch

    For the bullish scenario to play out, Bitcoin needs to:

    • Hold support above $84,000
    • Break through $87,300 resistance
    • Maintain momentum above $90,000
    • Target the pattern objective of $115,000

    Traders should monitor volume profiles and order book depth for confirmation of directional moves, while maintaining appropriate risk management strategies given the current market volatility.

  • SUI Price Eyes $2.50 Target as Bullish Channel Pattern Emerges

    The SUI cryptocurrency is showing promising technical signals despite recent market consolidation, with a key ascending channel pattern suggesting potential upside to $2.50. This technical analysis comes as the asset maintains crucial support above $2.26 while institutional interest grows through ETF developments.

    Technical Analysis Points to Bullish SUI Setup

    Renowned crypto analyst Ali Martinez has identified an ascending channel formation on SUI’s 4-hour chart, dating back to March 11. This bullish technical pattern, characterized by parallel upward-sloping trendlines, indicates steady buying pressure despite recent choppy price action.

    Key technical levels to watch:

    • Critical support: $2.26
    • Immediate resistance: $2.50
    • Breakout target: $3.00
    • Breakdown risk level: $1.75

    ETF Developments Boost Institutional Interest

    Adding to the bullish momentum, Canary Capital recently filed for a SUI spot ETF with the SEC, following their trust registration in Delaware. This development mirrors the institutional adoption path seen with Bitcoin and Ethereum ETFs, potentially opening new investment channels for SUI.

    SPONSORED

    Trade SUI with up to 100x leverage on perpetual contracts

    Trade Now on Defx

    Current Market Status and Price Action

    SUI currently trades at $2.28, showing resilience despite broader market uncertainty. While trading volume has decreased by 31.69%, suggesting temporary reduced market participation, the asset maintains its position as a significant player in the current market cycle after reaching an all-time high of $5.35 in early 2025.

    FAQ Section

    What is the key support level for SUI?

    The critical support level is $2.26, which coincides with the lower trendline of the ascending channel.

    What is the potential upside target for SUI?

    The immediate target is $2.50, with potential for extension to $3.00 if the breakout occurs with strong volume.

    How does the SUI ETF filing impact price action?

    The ETF filing could attract institutional investment, potentially increasing buying pressure and supporting higher price levels.