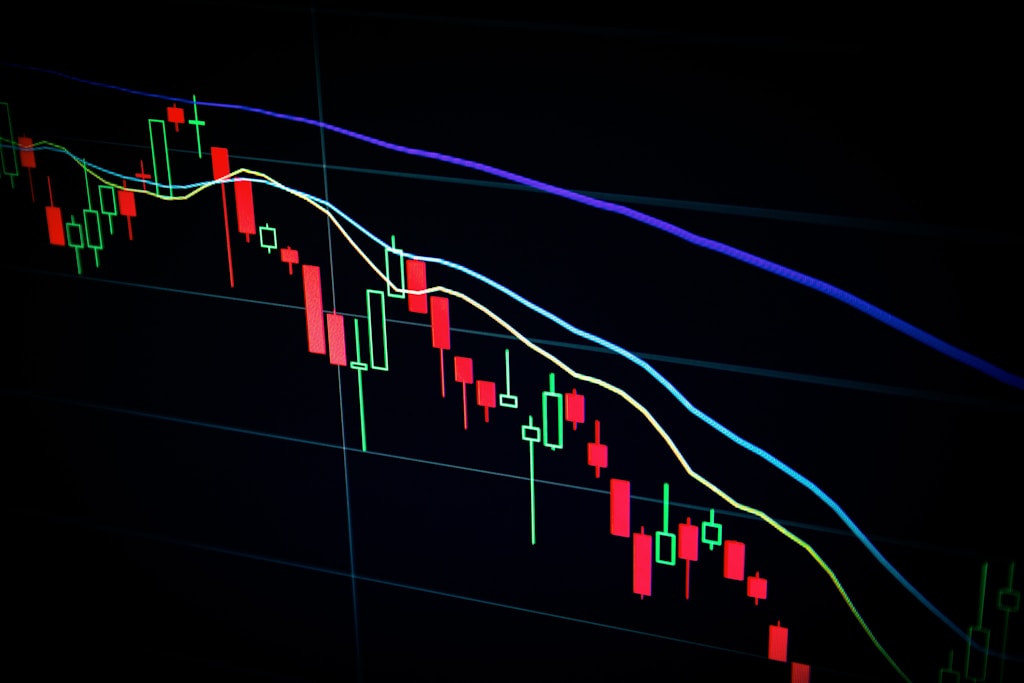
Tag: Trading Strategy

  • Ethereum Price Crashes Below $2,500: Key Support Levels to Watch

    Ethereum Price Crashes Below $2,500: Key Support Levels to Watch

    Ethereum’s price trajectory has taken a bearish turn, breaking below the critical $2,500 psychological barrier as market sentiment shifts. This comprehensive analysis examines the technical indicators, support levels, and potential price targets that traders should monitor in the coming days.

    Key Takeaways:

    • ETH price dropped below $2,550, forming a new local low at $2,394
    • Critical support levels established at $2,400, $2,380, and $2,320
    • Technical indicators suggest mounting bearish pressure
    • Key resistance levels to watch at $2,500 and $2,540

    Technical Analysis Deep Dive

    Similar to Bitcoin’s recent price action, Ethereum has encountered significant selling pressure. The breakdown below the rising channel support at $2,610 marks a notable technical deterioration, suggesting bears have gained control of the short-term price action.

    SPONSORED

    Trade ETH with up to 100x leverage and maximize your profit potential

    Trade Now on Defx

    Critical Support Levels

    The immediate support zone lies at $2,400, with secondary support at $2,380. A breach below these levels could trigger an extended decline toward $2,320. The 100-hourly Simple Moving Average currently provides dynamic resistance above current prices.

    Resistance Zones and Recovery Scenarios

    For any meaningful recovery, ETH needs to reclaim the following levels:

    • $2,460 (23.6% Fibonacci retracement)
    • $2,500 (psychological resistance)
    • $2,540 (50% Fibonacci retracement)

    Technical Indicators Analysis

    Current technical readings paint a bearish picture:

    • MACD: Gaining bearish momentum
    • RSI: Trading below 50, indicating bearish control
    • Moving Averages: Price trading below key SMAs

    FAQ Section

    What caused Ethereum’s price drop below $2,500?

    The decline appears technical in nature, triggered by a breakdown of key support levels and increased selling pressure in the broader crypto market.

    Could ETH drop further from current levels?

    Technical indicators suggest potential for further downside, with $2,320 representing the next major support level.

    What would signal a trend reversal?

    A decisive break above $2,540 with strong volume would indicate potential trend reversal and could trigger a rally toward $2,650.

    Time to Read: 4 minutes

  • Trump-Musk Twitter Feud Sparks Crypto Market Drama: DOGE Down

    Trump-Musk Twitter Feud Sparks Crypto Market Drama: DOGE Down

    The crypto world is witnessing an unprecedented social media showdown between two of its most influential figures, as former President Donald Trump and Tesla CEO Elon Musk’s relationship deteriorates publicly on Twitter. This development comes at a crucial time for cryptocurrency markets, particularly affecting Dogecoin’s price movement.

    The Break-Up That Shook Crypto Twitter

    The public falling out between Trump and Musk represents more than just a social media spat – it signals a potential shift in the crypto market’s power dynamics. As two of the most influential voices in both traditional and crypto markets, their discord has immediate implications for digital asset valuations and market sentiment.

    Market Impact and Trading Implications

    The feud has already triggered significant market movements, particularly in the meme coin sector. Recent data shows a surprising $53M surge in Solana-based meme coins as traders shift their positions in response to the drama.

    SPONSORED

    Trade meme coins with leverage in spot margin on Solana

    Trade Now on Defx

    Expert Analysis and Market Outlook

    Cryptocurrency analysts suggest this public dispute could have lasting implications for market dynamics, particularly for assets associated with either figure. The immediate impact has been most visible in Dogecoin’s price action, with technical indicators suggesting increased volatility ahead.

    FAQ Section

    How does this affect Dogecoin’s price?

    The immediate market reaction has shown increased volatility, with potential for further price movements as the situation develops.

    What are the broader implications for crypto markets?

    This event highlights the ongoing influence of high-profile figures on crypto market sentiment and could lead to shifts in investor behavior.

    Looking Ahead: Market Implications

    As this situation continues to unfold, traders and investors should monitor social media developments closely while maintaining focus on fundamental market indicators. The crypto market’s reaction to this high-profile dispute demonstrates the increasing intersection between social media influence and digital asset valuations.

  • Dogecoin Price Must Break $0.40 or Face Extended Bear Market

    Dogecoin (DOGE) faces a critical juncture as prominent analyst VisionPulsed warns that the popular memecoin must break above $0.40 in the coming weeks to maintain its bullish structure. This analysis comes amid mounting pressure after five consecutive months of losses since January 2025.

    The technical outlook draws particular attention to Ethereum’s momentum indicators, which VisionPulsed believes could signal broader market movements. The analyst highlighted consecutive “blue bars” on ETH’s oscillator that historically preceded significant price action. This technical setup mirrors patterns seen during previous DOGE price corrections, suggesting a potential correlation between ETH momentum and DOGE price action.

    Critical Price Levels and Timing Model

    At the heart of VisionPulsed’s analysis is a 70-day timing model that has accurately predicted previous Dogecoin rallies. The model suggests June 14 as a pivotal date for potential price movement, with the analyst noting that “every major upswing in Dogecoin during this cycle has come 60 to 80 days after a bottom.”

    SPONSORED

    Trade DOGE with up to 100x leverage and maximize your profit potential

    Trade Now on Defx

    Market Structure Analysis

    The current market structure presents a complex picture. While Bitcoin trades near cycle highs, Dogecoin remains significantly below its yearly peak – a divergence that VisionPulsed interprets as potential stored energy for a dramatic move. Technical indicators, including narrowing Bollinger Bands and declining on-chain activity, suggest building momentum.

    Potential Scenarios and Price Targets

    Two distinct scenarios emerge from the analysis:

    • Bullish Case: A break above $0.40 could trigger a substantial rally, potentially coinciding with ETH reaching $3,200-$4,200
    • Bearish Case: Failure to breach $0.40 could result in extended downside, with June, July, and September all potentially showing negative returns

    FAQ Section

    What makes $0.40 such a critical level for Dogecoin?

    This price point represents a major technical resistance level and coincides with previous support zones from earlier in the cycle.

    How does Bitcoin’s performance affect Dogecoin’s prospects?

    Historical data shows that Bitcoin’s breakouts typically lead to delayed but amplified moves in Dogecoin, particularly during bull markets.

    What technical indicators support the current analysis?

    Key indicators include Bollinger Band compression, declining on-chain activity, and the 70-day timing model derived from previous cycle lows.

    At time of writing, DOGE trades at $0.189, with immediate resistance at $0.25 and major resistance at the crucial $0.40 level.

  • Bitcoin Eyes $115K by July as Job Data and CFTC Pick Drive Rally

    Bitcoin Eyes $115K by July as Job Data and CFTC Pick Drive Rally

    Bitcoin’s potential surge to $115K by July is gaining momentum, with analysts closely watching two critical factors: upcoming U.S. employment data and a crypto-friendly CFTC nomination. This analysis builds on recent market developments, including technical indicators showing trend exhaustion at $105K.

    Market Catalysts: Jobs Data and Regulatory Shift

    The cryptocurrency market stands at a crucial juncture, with Bitcoin’s price action heavily dependent on this week’s U.S. employment figures. Weak job data could accelerate the rally by encouraging dovish Fed policies, while stronger numbers might trigger a temporary pullback.

    Adding to the bullish narrative, Trump’s CFTC nominee Brian Quintenz brings significant crypto expertise from his tenure at a16z Crypto. His appointment could herald a more favorable regulatory environment, potentially catalyzing institutional adoption.

    SPONSORED

    Maximize your trading potential with up to 100x leverage on perpetual contracts

    Trade Now on Defx

    Top Crypto Investment Opportunities

    1. BTC Bull Token ($BTCBULL)

    Currently priced at $0.00255, $BTCBULL offers a unique value proposition by rewarding holders with actual Bitcoin as BTC reaches key price milestones. With $6.8M raised in presale, this token combines meme coin appeal with tangible benefits.

    2. Best Wallet Token ($BEST)

    Trading at $0.025135, $BEST powers a next-generation Web3 platform challenging established players like MetaMask. With $13.1M raised and growing institutional interest, it represents a strategic entry into the crypto infrastructure sector.

    3. Smog Token ($SMOG)

    At $0.008897, this multichain token offers an innovative approach to community rewards through its Dragon’s Court ecosystem. Its expansion to Ethereum opens new opportunities for cross-chain growth.

    Market Outlook and Risk Factors

    While the path to $115K appears promising, investors should monitor several risk factors, including:

    • Employment data impact on Fed policy
    • Regulatory developments under new CFTC leadership
    • Institutional accumulation patterns
    • Market liquidity conditions

    Disclaimer: This article is for informational purposes only. Always conduct thorough research before making investment decisions.

  • Dogecoin Price Crashes Below $0.20: Technical Analysis Reveals Next Moves

    Dogecoin Price Crashes Below $0.20: Technical Analysis Reveals Next Moves

    The cryptocurrency market witnessed a significant development as Dogecoin (DOGE) experienced a notable price decline, breaking below the crucial $0.20 support level following Bitcoin’s retreat from $104,000. This technical analysis deep-dive examines the key factors behind this movement and what traders can expect next.

    Understanding the Recent DOGE Price Action

    As previously predicted by analysts tracking critical triangle patterns, Dogecoin’s price structure has shown signs of weakness. Crypto analyst Smart Flows from TradingView has identified a crucial 4-hour order block (OB) development that explains the recent price action.

    Technical Breakdown of the Liquidity Sweep

    The price movement can be broken down into several key components:

    • Initial support break at $0.22 price level
    • Liquidity sweep through the Fair Value Gap (FVG)
    • Break of psychological $0.20 support
    • Reset of market sentiment indicators

    SPONSORED

    Trade DOGE with up to 100x leverage on perpetual contracts

    Trade Now on Defx

    Critical Price Levels to Watch

    Traders should focus on these key price levels:

    • Primary resistance: $0.20928 (key reaction point)
    • Secondary resistance: $0.22094 (4-Hour order block)
    • Support level: $0.18000
    • Critical support: $0.16387 (deeper 4H OB)

    Potential Scenarios and Trading Implications

    Two primary scenarios are emerging:

    Bullish Case

    A successful clearance of the FVG above $0.20 could trigger a continuation pattern, potentially leading to a retest of the $0.22 level. This scenario aligns with broader market recovery expectations.

    Bearish Case

    Early rejection at current levels could signal distribution, potentially leading to a sweep below $0.18 and a retest of deeper support at $0.16387.

    FAQ Section

    What caused Dogecoin’s price to drop below $0.20?

    The drop was primarily triggered by Bitcoin’s price decline below $104,000 and a technical liquidity sweep through key support levels.

    Is this a good time to buy Dogecoin?

    Traders should wait for confirmation of support at current levels and watch for a clear break above $0.209 before considering long positions.

    What are the key support levels to watch?

    The primary support zones are at $0.18 and $0.16387, with the latter representing a crucial demand zone.

    As the market continues to digest this price action, traders should maintain strict risk management and watch for clear confirmations before taking positions. The next few days will be crucial in determining whether Dogecoin can maintain its structural integrity above key support levels.

  • Bitcoin Price Dips 9% to $105K: On-Chain Metrics Signal Accumulation Phase

    Bitcoin Price Dips 9% to $105K: On-Chain Metrics Signal Accumulation Phase

    Bitcoin’s price has pulled back 9.3% in the last 24 hours to $105,062, marking an 8% decline from its recent all-time high. While short-term volatility has increased, multiple on-chain indicators suggest this dip may be setting up for the next leg higher.

    This analysis comes as long-term holder confidence reaches new highs, with key metrics pointing to sustained accumulation despite price weakness.

    Key On-Chain Metrics Paint Bullish Picture

    According to CryptoQuant analyst Amr Taha, three critical on-chain trends are emerging:

    • Binance spot trading volume share increased from 26% to 35% since early June
    • Long-Term Holder Net Position Realized Cap exceeded $20 billion
    • Over 20,000 BTC withdrawn from Kraken and Bitfinex in 48 hours

    Exchange Dynamics Signal Institutional Interest

    The surge in Binance’s market share comes as retail demand shows signs of cooling. However, institutional-sized withdrawals from major exchanges suggest smart money may be accumulating during this dip.

    SPONSORED

    Trade Bitcoin with up to 100x leverage on perpetual contracts

    Trade Now on Defx

    Long-Term Holder Confidence Remains Strong

    The Long-Term Holder Net Position Realized Cap surpassing $20 billion indicates veteran investors are holding firm. Historically, such accumulation patterns have preceded significant price expansions.

    FAQ: Bitcoin Market Outlook

    What’s causing the current Bitcoin price dip?

    The pullback appears technical in nature, coming after Bitcoin reached new all-time highs. On-chain data suggests this is more likely a healthy correction than the start of a major downtrend.

    Are whales selling their Bitcoin holdings?

    On-chain metrics indicate the opposite – large holders are actually accumulating, with over 20,000 BTC moving off exchanges into private wallets in recent days.

    What’s the next key support level for Bitcoin?

    Major support sits at the psychological $100,000 level, with additional technical support around $98,500 based on the 21-day moving average.

    Conclusion: Accumulation Continues Despite Volatility

    While short-term price action has turned bearish, the underlying on-chain metrics paint a picture of continued accumulation by long-term holders and institutions. This divergence between price and fundamentals often presents opportunities for strategic position building.

  • XRP Price Tests $2.20 Support: Key Indicators Signal Potential Rally

    XRP Price Tests $2.20 Support: Key Indicators Signal Potential Rally

    XRP’s price action is showing signs of a potential bullish reversal after finding strong support at $2.20, with technical indicators suggesting an imminent breakout could be on the horizon. This analysis comes as major institutional players like Webus signal increased interest in XRP, potentially adding significant buying pressure to the market.

    Current Market Structure Analysis

    XRP has established a critical support zone between $2.185 and $2.20, with multiple technical factors converging to create a strong foundation for potential upward movement:

    • 100-hourly Simple Moving Average providing dynamic support
    • Bullish trend line formation at $2.185
    • 61.8% Fibonacci retracement level alignment
    • Previous resistance turned support at $2.220

    Key Resistance Levels to Watch

    For bulls to regain control, several critical resistance levels must be overcome:

    • Immediate resistance: $2.2320
    • Major psychological level: $2.250
    • Previous high resistance: $2.2850
    • Extended target zone: $2.320-$2.380

    SPONSORED

    Trade XRP with up to 100x leverage and maximize your profit potential

    Trade Now on Defx

    Technical Indicator Analysis

    Current technical indicators present a mixed but potentially bullish scenario:

    • MACD: Showing decreased momentum in the bullish zone
    • RSI: Currently below 50, indicating potential oversold conditions
    • Moving Averages: Price maintaining position above 100-hour SMA

    Support Zones and Downside Risks

    In case of a bearish turn, these support levels should be monitored:

    Support Level Price Point Significance
    Primary Support $2.20 Current consolidation base
    Secondary Support $2.1850 Trend line support
    Critical Support $2.150 Previous swing low

    Frequently Asked Questions

    What is the next major resistance level for XRP?

    The immediate major resistance level is at $2.250, followed by $2.2850.

    Could XRP break below current support levels?

    If $2.1850 support breaks, XRP could test lower supports at $2.150 and $2.120.

    What technical indicators should traders watch?

    Key indicators to monitor include the MACD, RSI, and the 100-hour SMA position.

    Trading Implications

    Traders should consider the following strategies:

    • Long entries near $2.20 support with tight stops
    • Resistance scalping opportunities at $2.250
    • Break and retest plays at $2.2850

    As always, proper risk management and position sizing remain crucial for trading success in these volatile market conditions.

  • Bitcoin Price Warning: $100K Support Test Looms as Analysts Eye 10% Drop

    Bitcoin Price Warning: $100K Support Test Looms as Analysts Eye 10% Drop

    Bitcoin’s meteoric rise to $111,900 could face a significant correction, with multiple analysts warning of an impending price drop below the psychological $100,000 level. This analysis comes as retail demand shows concerning weakness despite BTC’s elevated price levels.

    Technical Indicators Signal Potential Bitcoin Price Correction

    Several prominent crypto analysts have identified bearish signals that could trigger a substantial price correction:

    • RSI trending downward to neutral 50 level
    • Bearish MACD crossover confirmed last week
    • Key resistance at $106,406 proving difficult to overcome
    • ETF outflows showing early warning signs

    SPONSORED

    Protect your trading positions with up to 100x leverage on perpetual contracts

    Trade Now on Defx

    Geopolitical Tensions Add to Bearish Pressure

    The escalating Russia-Ukraine conflict has emerged as a significant factor that could drive investors toward traditional safe-haven assets like gold, potentially triggering a Bitcoin selloff. This geopolitical uncertainty, combined with technical weakness, suggests increased downside risk.

    Price Targets and Support Levels

    Key price levels to watch according to analysts:

    • Primary support: $100,000 psychological level
    • Secondary support: $96,765 (Stephan’s target)
    • Critical resistance: $106,800
    • Bullish scenario target: $135,000

    Expert Price Predictions

    Despite short-term bearish signals, several analysts maintain optimistic longer-term outlooks:

    • Titan of Crypto: $135,000 target based on wedge breakout
    • Mikybull Crypto: $120,000 magnetic level
    • Peter Brandt: $150,000 by late summer 2025

    FAQ Section

    What could trigger a Bitcoin price crash below $100,000?

    Technical factors including bearish MACD crossover, weakening RSI, and geopolitical tensions could combine to trigger a significant correction.

    What are the key support levels to watch?

    The primary support sits at $100,000, with secondary support at $96,765. A break below these levels could accelerate selling pressure.

    Could Bitcoin still reach new highs in 2025?

    Despite short-term bearish signals, analysts maintain targets between $120,000 and $150,000 for late 2025, suggesting the current correction could present buying opportunities.

    At time of writing, Bitcoin trades at $105,400, with immediate focus on the critical $106,800 resistance level that could determine near-term price direction.

  • Dogecoin Price Alert: Critical June Breakout Could Prevent 6-Month Downtrend

    Dogecoin (DOGE) stands at a crucial inflection point that could determine its price trajectory for the next six months, according to prominent crypto analyst VisionPulsed. Technical indicators suggest an imminent major move that must materialize within the next two weeks to avoid prolonged bearish conditions.

    Technical Analysis Points to Major Price Movement

    The Bollinger Band Width Percentile (BBWP) for DOGE is showing extreme compression levels that historically precede significant price expansion. This technical setup, combined with a newly triggered hash-ribbon buy signal, suggests heightened volatility is imminent.

    “We’re going to get a large move in June. The question is simply direction,” notes VisionPulsed, highlighting that the current BBWP readings cannot sustain beyond the next two weekly candles.

    SPONSORED

    Trade DOGE with up to 100x leverage on perpetual contracts

    Trade Now on Defx

    Critical Timing Window for Bulls

    The analysis reveals a 70-to-80-day cycle pattern in Dogecoin’s price movements, with the current window set to expire in mid-June. This timing coincides with crucial support levels that could trigger a recovery if properly defended.

    Adding to the complexity, the stock-RSI on the two-day chart has turned lower for the first time since 2024, potentially threatening the bullish scenario. A failure to quickly recover could invalidate recent positive signals and usher in an extended bearish phase.

    Macro Factors and Market Structure

    The broader market context adds another layer of significance to Dogecoin’s current position. With the S&P 500 approaching all-time highs, traditional market movements could significantly influence crypto sentiment. Meanwhile, DOGE continues forming higher lows – a constructive but fragile pattern that needs immediate upside continuation to remain valid.

    Binary Outcome Scenario

    For traders, the situation presents a clear binary choice:

    • Upside Breakout: Would validate technical signals and maintain bullish structure
    • Failure to Rally: Could trigger a “bearish spiral” lasting through summer

    At press time, DOGE trades at $0.1958, with immediate resistance at $0.20 and support at $0.185.

    Frequently Asked Questions

    Q: What is the key price level Dogecoin needs to break?
    A: The immediate resistance at $0.20 needs to be cleared within the next two weeks to avoid bearish continuation.

    Q: How long could the bearish phase last if June fails to deliver upside?
    A: Analysis suggests potential bearish conditions could extend through September, resulting in six consecutive red monthly candles.

    Q: What technical indicators are currently most relevant?
    A: The Bollinger Band Width Percentile (BBWP) and hash-ribbon signals are primary indicators to watch, along with the 70-80 day cycle pattern.

  • Bitcoin Price Alert: $98K Support Level Could Trigger Major Altcoin Rally

    Bitcoin Price Alert: $98K Support Level Could Trigger Major Altcoin Rally

    Bitcoin’s price trajectory is showing signs of a potential correction after reaching new heights above $100,000. While the leading cryptocurrency maintains bullish momentum, technical analysis suggests an imminent retracement that could present significant buying opportunities across the crypto market.

    Technical Analysis Points to Strategic Bitcoin Price Levels

    According to respected crypto analyst Xanrox, Bitcoin is breaking down from an ascending parallel channel that formed during its climb from $74,000 to $112,000. This technical pattern, combined with recent resistance tests at the $107,000 level, suggests a corrective phase may be imminent.

    Key technical factors supporting this analysis include:

    • Formation of a symmetrical triangle pattern within the channel
    • Completion of five Elliott Wave theory waves
    • Multiple unfilled Fair Value Gaps (FVG)
    • Critical Fibonacci retracement levels at $98,000, $92,000, and $87,500

    Strategic Buying Zones Identified

    The analysis points to three potential buying zones based on Fibonacci retracement levels:

    • Primary support: $98,000 (0.382 Fibonacci level)
    • Secondary support: $92,000 (0.500 Fibonacci level)
    • Final support: $87,500 (0.618 Fibonacci level)

    SPONSORED

    Trade Bitcoin with up to 100x leverage and maximize your profit potential

    Trade Now on Defx

    Implications for Altcoin Markets

    The anticipated Bitcoin correction could create prime buying opportunities in the altcoin market. As historically observed, significant Bitcoin price movements often precede larger percentage moves in alternative cryptocurrencies. Recent data showing decreased selling pressure from long-term holders suggests the correction may be relatively short-lived.

    FAQ: Key Points for Traders

    When should investors consider entering positions?

    The first major buying opportunity presents itself at the $98,000 level, coinciding with the 0.382 Fibonacci retracement.

    What indicators support this analysis?

    Multiple technical factors including Elliott Wave completion, symmetrical triangle formation, and unfilled Fair Value Gaps support the correction thesis.

    How might this affect altcoin prices?

    Altcoins typically experience more significant percentage moves during Bitcoin corrections, potentially offering enhanced buying opportunities.

    As the market prepares for this potential correction, traders should maintain strict risk management practices and consider dollar-cost averaging into positions at the identified support levels.