Tag: Trading Strategy

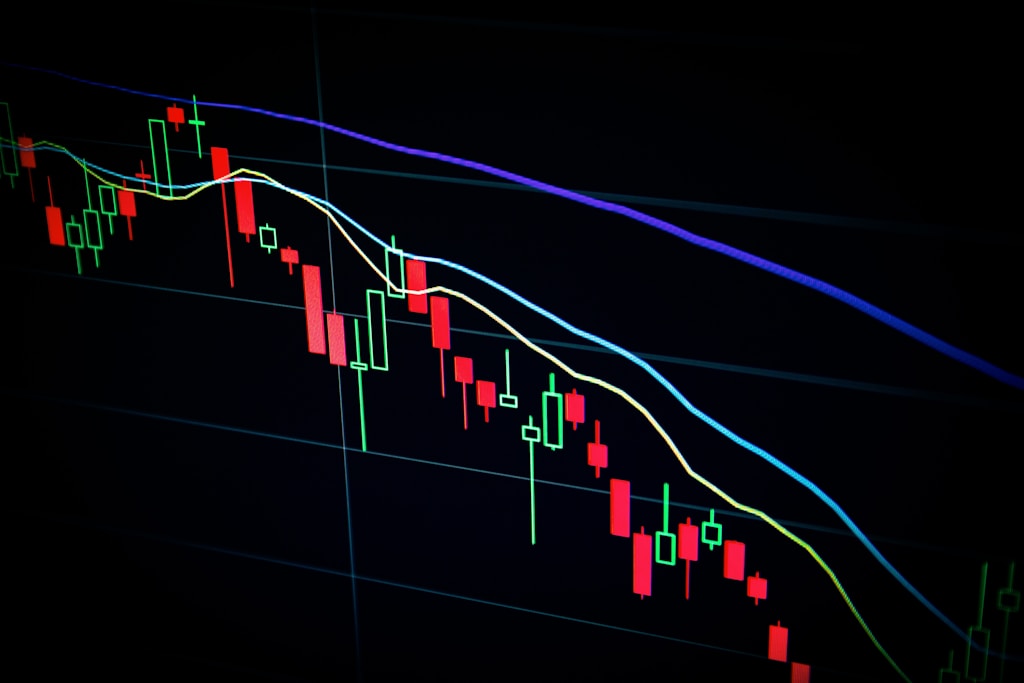
  • Fibonacci Retracement Strategy: Master Bitcoin Trading with 61.8% Rule

    Fibonacci Retracement Strategy: Master Bitcoin Trading with 61.8% Rule

    In the ever-evolving landscape of Bitcoin trading, mastering Fibonacci retracement levels has become essential for identifying crucial price support and resistance zones. As Bitcoin continues testing new highs near $110K, understanding these mathematical patterns could be the key to maximizing your trading success.

    What is Fibonacci Retracement?

    Fibonacci retracement is a technical analysis tool based on the mathematical sequence discovered by Leonardo Fibonacci. In trading, the key levels are 23.6%, 38.2%, 61.8%, and 78.6% – with 61.8% being the golden ratio that traders watch most closely.

    Why Fibonacci Matters in Bitcoin Trading

    Recent market data shows that Bitcoin frequently respects these mathematical levels during both bullish and bearish moves. For instance, during the recent pullback from $107K, BTC found strong support at the 38.2% Fibonacci level ($98,200), demonstrating the tool’s reliability.

    SPONSORED

    Trade Bitcoin with precision using up to 100x leverage on perpetual contracts

    Trade Now on Defx

    Implementing Fibonacci in Your Trading Strategy

    • Identify trend direction
    • Draw Fibonacci levels from swing low to high (uptrend) or high to low (downtrend)
    • Watch for price reactions at key levels
    • Combine with other technical indicators for confirmation

    Common Fibonacci Trading Mistakes to Avoid

    Many traders make the mistake of relying solely on Fibonacci levels without considering other technical indicators or market fundamentals. As recent market analysis shows, combining Fibonacci with tools like the Mayer Multiple can provide more reliable trading signals.

    FAQ

    What is the most important Fibonacci level?

    The 61.8% level is considered the most significant, often providing the strongest support or resistance.

    How accurate are Fibonacci retracements?

    While not perfect, studies show Fibonacci levels have a 70-80% accuracy rate when combined with other technical indicators.

    Can Fibonacci work in bear markets?

    Yes, Fibonacci retracements are equally effective in both bull and bear markets for identifying potential reversal points.

  • Bitcoin’s $10K Pattern Signals Strong Push Toward $115K Target

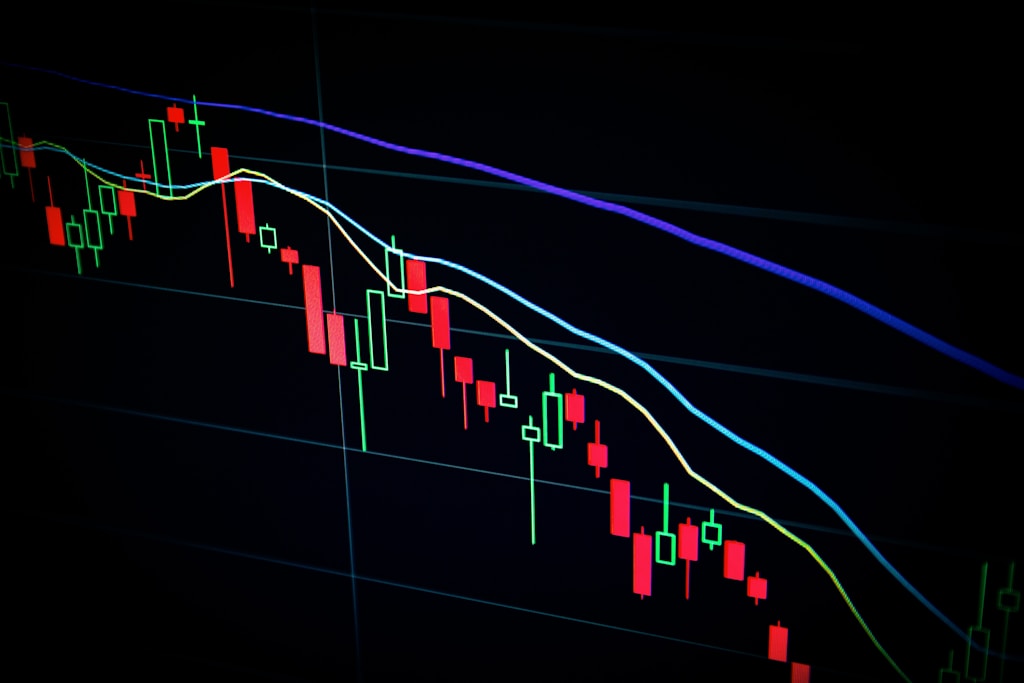
    Bitcoin’s methodical price action is revealing a fascinating pattern that could signal significant upside potential. The leading cryptocurrency has been steadily climbing in $10,000 increments, suggesting a calculated march toward new highs.

    After experiencing turbulence earlier this year with a sharp decline from $109,000 to $74,600, Bitcoin has shown remarkable resilience. Recent whale activity supporting the $103K level has helped establish a solid foundation for further gains.

    The $10,000 Stair-Step Pattern

    Technical analyst Trader Tardigrade has identified a consistent pattern in Bitcoin’s recent price action. The cryptocurrency has been advancing in clear $10,000 intervals, with each surge followed by a 7-10 day consolidation period. This methodical progression has taken Bitcoin from $75,000 to its current trading range above $100,000.

    SPONSORED

    Trade Bitcoin with up to 100x leverage on perpetual contracts

    Trade Now on Defx

    Key Support Levels and Market Psychology

    The psychological $100,000 level has become a crucial support zone. Bitcoin’s historic weekly close above $106K demonstrates the strength of this upward momentum. Each consolidation phase has created new support levels, reducing the risk of significant pullbacks.

    Long-term Projections Point Higher

    While the immediate target sits at $115,000, some analysts are looking much further ahead. CryptoCon’s analysis using the Golden Ratio Multiplier suggests potential targets as high as $160,000. This projection aligns with historical patterns, particularly the 2015-2017 bull cycle.

    FAQ

    Q: What is driving Bitcoin’s current price action?
    A: A combination of technical patterns, strong holder behavior, and institutional adoption is supporting the steady price increases.

    Q: How reliable is the $10,000 increment pattern?
    A: While past performance doesn’t guarantee future results, the pattern has shown consistency over multiple cycles since reaching $75,000.

    Q: What could invalidate this bullish scenario?
    A: A break below the $100,000 support level or failure to maintain the established pattern could signal a shift in market dynamics.

  • XRP Price Tests $2.35 Support: Key Levels Signal Potential Reversal

    XRP’s price action has entered a critical phase as the digital asset struggles to maintain momentum above the $2.35 support level. Recent market data suggests a potential shift in trend direction, with technical indicators pointing to increased selling pressure. This analysis explores the key levels traders should watch and potential scenarios for XRP’s next major move.

    Current Market Position

    XRP has experienced a notable correction, falling below several key technical levels:

    • Price dropped below the crucial $2.480 resistance zone
    • Trading activity now occurs under the 100-hourly Simple Moving Average
    • A bullish trend line has formed with support at $2.3550
    • Key support levels established at $2.350 and $2.320

    Similar to Ethereum’s recent test of critical support levels, XRP’s price action suggests a potential continuation of the broader market consolidation phase.

    Technical Analysis Deep Dive

    The current price structure reveals several critical technical developments:

    • Fibonacci retracement levels show significant resistance at $2.450
    • The 61.8% retracement level aligns with the trend line support
    • MACD indicator signals increasing bearish momentum
    • RSI remains below 50, indicating sustained selling pressure

    SPONSORED

    Trade XRP with up to 100x leverage and maximize your profit potential

    Trade Now on Defx

    Key Support and Resistance Levels

    Traders should monitor these critical price levels:

    Support Levels Resistance Levels
    $2.350 $2.450
    $2.320 $2.500
    $2.200 $2.600

    Potential Scenarios

    Two primary scenarios emerge from the current technical setup:

    Bullish Case

    • Break above $2.450 could trigger push toward $2.600
    • Sustained trading above $2.500 might target $2.680
    • Ultimate resistance stands at $2.800

    Bearish Case

    • Failure to hold $2.320 support could trigger decline to $2.200
    • Further weakness might test $2.120 support zone
    • RSI suggests increased probability of downside continuation

    Frequently Asked Questions

    Q: What’s the most critical support level for XRP right now?
    A: The $2.350 level represents the most immediate crucial support, with $2.320 serving as the last defense before a potential larger correction.

    Q: Could XRP recover to $2.500 in the near term?
    A: While possible, XRP needs to first clear the immediate resistance at $2.450 and show sustained buying pressure above this level.

    Q: What technical indicators should traders watch?
    A: The MACD and RSI are currently the most reliable indicators, with both suggesting continued bearish pressure in the short term.

    Conclusion

    XRP’s price action at current levels will likely determine its trajectory for the coming weeks. While the asset maintains support above $2.350, the technical structure suggests caution. Traders should closely monitor the identified support and resistance levels for potential trading opportunities.

  • Solana Price Tests $166 Support: SOL Bulls Eye $183 Breakout Target

    Solana Price Tests $166 Support: SOL Bulls Eye $183 Breakout Target

    Solana (SOL) is navigating a critical price zone after retreating from its recent peak of $183, with bulls defending key support at $166. Recent profit-taking activity has put pressure on SOL’s upward momentum, though technical indicators suggest potential for renewed strength.

    Key Support Level Holds Strong at $166

    At press time, Solana trades at $169.43, showing resilience with a modest 0.70% daily gain. The cryptocurrency has established strong support at $166.82, successfully defending this level through multiple retests. This price action demonstrates significant buyer interest at current levels, potentially setting up for the next leg higher.

    SPONSORED

    Trade Solana with up to 100x leverage on perpetual contracts

    Trade Now on Defx

    Technical Analysis Points to Potential Breakout

    According to TradingView analysis, SOL’s recent price action forms a clear technical pattern:

    • Strong support established at $166.82
    • Key resistance levels at $177.51 and $183.86
    • Bullish momentum building on 4-hour timeframe
    • Volume profile suggests accumulation at current levels

    Market Volume Shows Room for Growth

    Trading volume has declined 36.15% to $2.3 billion in the past 24 hours, suggesting a period of consolidation. This reduced volume environment typically precedes major price moves, with traders watching for increased participation to confirm the next directional break.

    Key Price Levels to Watch

    Traders should monitor these critical price zones:

    • Primary Support: $166.82
    • Secondary Support: $142.25
    • First Resistance: $177.51
    • Major Resistance: $183.86
    • Upside Target: $190-$200 range

    Risk Factors and Trading Considerations

    While the technical setup appears promising, traders should consider several risk factors:

    • Declining volume needs to reverse for sustainable moves higher
    • Break below $166 could trigger deeper correction to $142.25
    • Overall market sentiment remains a key influence on price action

    Conclusion: Solana at Decision Point

    Solana stands at a crucial technical juncture, with strong support providing a foundation for potential upside. A decisive break above $177.51 could trigger renewed momentum toward the $190-$200 range. However, traders should remain vigilant of volume patterns and broader market conditions when positioning.

  • Cardano Price Alert: ADA Eyes $0.92 After Potential $0.75 Correction

    Cardano Price Alert: ADA Eyes $0.92 After Potential $0.75 Correction

    Cardano (ADA) is showing mixed signals in its latest market structure, with technical analysis pointing to both an imminent correction and subsequent bullish potential. While short-term indicators suggest a pullback to the $0.75 support zone, broader patterns indicate a possible rally toward $0.92.

    Technical Analysis Points to Short-Term Correction

    Prominent TradingView analyst SiDec has identified a complex technical setup for ADA, currently trading at $0.78. The analysis, based on Elliott Wave Theory and multiple technical indicators, suggests a corrective phase is underway after completing a bullish 5-wave impulse move.

    Similar to patterns seen in recent XRP price movements, Cardano is displaying a textbook ABC correction pattern, with Wave C expected to complete near the $0.75 support zone.

    Critical Support Levels Align at $0.75

    Multiple technical indicators converge around the $0.75 price level:

    • 50% Fibonacci retracement at $0.7534
    • Previous resistance turned support at $0.746
    • 21-day EMA at $0.7455
    • 21-day SMA at $0.7347
    • Volume Point of Control (POC) near $0.7318

    SPONSORED

    Trade ADA with up to 100x leverage on perpetual contracts

    Trade Now on Defx

    Bullish Case for $0.92 Target

    Despite the short-term bearish outlook, the broader trend remains constructive. Once the correction completes, technical patterns suggest a potential rally toward $0.92. However, traders should watch for confirmation signals including:

    • Bearish engulfing candle reversals
    • Clear divergence patterns
    • Volume confirmation at support levels

    FAQ Section

    What is the immediate support level for Cardano?

    The strongest support cluster exists around $0.75, with multiple technical indicators converging at this level.

    What is the upside target after the correction?

    Technical analysis suggests $0.92 as the next major target, though traders should watch for rejection at this resistance level.

    How long might the correction last?

    While timing exact bottoms is challenging, the completion of the ABC correction pattern typically signals the end of the corrective phase.

  • XRP Price Tests $2.35 Support: Key Levels Signal Bear Trap Formation

    XRP Price Tests $2.35 Support: Key Levels Signal Bear Trap Formation

    XRP’s price action is showing intriguing technical patterns as the cryptocurrency tests critical support levels around $2.35. While bears appear to have control in the short term, multiple indicators suggest this could be a tactical bear trap, as noted in recent analysis predicting an XRP surge to $3.

    Current Price Action and Technical Analysis

    The digital asset has entered a consolidation phase after experiencing downward pressure from the $2.65 resistance zone. Key technical developments include:

    • Price trading below both $2.50 and the 100-hourly SMA
    • Formation of a bearish trend line with resistance at $2.42
    • Critical support established at $2.35, with secondary support at $2.32
    • 23.6% Fibonacci retracement level providing temporary price stability

    Bear Trap Formation Analysis

    Despite the bearish short-term outlook, several factors suggest this could be a bear trap:

    • RSI hovering near oversold conditions at 50
    • MACD showing decreasing bearish momentum
    • Strong buying interest emerging near $2.35 support
    • Historical price action showing similar patterns before major rallies

    SPONSORED

    Trade XRP with up to 100x leverage on perpetual contracts

    Trade Now on Defx

    Key Price Levels to Watch

    Traders should monitor these critical levels:

    Type Level Significance
    Resistance $2.50 Major psychological level
    Resistance $2.42 Trend line resistance
    Support $2.35 Primary support
    Support $2.32 Secondary support

    Trading Scenarios and Risk Management

    Two primary scenarios are emerging:

    1. Bullish Scenario: Break above $2.50 could trigger movement toward $2.65-$2.80
    2. Bearish Scenario: Break below $2.32 might lead to testing $2.20 support

    FAQ Section

    What is causing XRP’s current price decline?

    The decline appears technical in nature, following broader market consolidation and profit-taking after recent gains.

    Could XRP still reach $3 despite current weakness?

    Technical indicators and market structure suggest the current dip could be temporary, with potential for continued upside once support levels hold.

    What are the key support levels to watch?

    Primary support sits at $2.35, with secondary support at $2.32. A break below these levels could trigger further selling.

    Technical Indicator Summary

    • MACD: Bearish momentum weakening
    • RSI: Below 50, approaching oversold conditions
    • Moving Averages: Price below 100-hour SMA
    • Volume: Declining on downward moves
  • Ethereum Price Shows Strength at $2,500: Bullish Pattern Forms

    Ethereum Price Shows Strength at $2,500: Bullish Pattern Forms

    Ethereum (ETH) is displaying remarkable resilience at the crucial $2,500 support level, with technical indicators suggesting a potential upward breakout could be imminent. As broader crypto market inflows reach $35B, ETH’s price action indicates growing momentum for a possible surge above $2,600.

    Key Technical Developments for Ethereum

    After reaching a local high of $2,740, Ethereum underwent a correction that tested the psychologically important $2,500 zone. However, several bullish indicators have emerged:

    • Price maintaining position above the 100-hourly Simple Moving Average
    • Formation of a potential bullish flag pattern at $2,575
    • Strong support established at the 76.4% Fibonacci retracement level
    • MACD showing increasing bullish momentum
    • RSI readings above 50, confirming positive sentiment

    SPONSORED

    Trade Ethereum with up to 100x leverage and maximize your potential returns

    Trade Now on Defx

    Critical Price Levels to Watch

    Traders should monitor these key levels for potential breakout or breakdown scenarios:

    Level Type Price Point Significance
    Immediate Resistance $2,575 Bullish flag pattern ceiling
    Major Resistance $2,650 Previous support turned resistance
    Key Support $2,500 Major psychological level
    Secondary Support $2,420 Previous swing low

    Potential Scenarios and Trading Implications

    Two primary scenarios are emerging for Ethereum’s short-term price action:

    Bullish Scenario

    A breakthrough above $2,600 could trigger a cascade of buying, potentially pushing ETH toward:

    • Initial target: $2,735
    • Secondary target: $2,800
    • Stretch target: $2,920

    Bearish Scenario

    Failure to maintain $2,500 support might lead to:

    • Initial decline to $2,420
    • Possible extension to $2,350
    • Worst case support at $2,320

    Frequently Asked Questions

    What is causing Ethereum’s current price movement?

    Ethereum’s price action is influenced by technical factors including the formation of a bullish flag pattern and strong support at $2,500, combined with broader market inflows reaching $35B.

    Technical Indicators Summary:

    • MACD: Bullish momentum increasing
    • RSI: Above 50, indicating positive momentum
    • Moving Averages: Price above 100-hourly SMA
    • Volume: Showing consistent support at key levels
  • Bitcoin Price Prediction: 37% of Traders Bet on $150K BTC in 2025

    Bitcoin Price Prediction: 37% of Traders Bet on $150K BTC in 2025

    Bitcoin’s meteoric rise above $100,000 has sparked intense speculation about its next major price target, with prediction markets showing strong bullish sentiment toward a $150,000 bitcoin price by year-end. A significant 37% of traders on Polymarket are betting on BTC reaching this ambitious milestone, highlighting growing confidence in the cryptocurrency’s upward trajectory.

    Bitcoin’s Six-Figure Momentum and Market Sentiment

    After maintaining its position above $100,000 for more than a week, Bitcoin continues to generate substantial interest from both retail and institutional investors. This sustained momentum aligns with recent analysis suggesting potential exit points between $150,000 and $200,000 during this bull market cycle.

    Prediction Markets Signal Strong Bullish Outlook

    Polymarket, a leading decentralized prediction platform, reveals compelling data:

    • 37% of traders expect Bitcoin to surpass $150,000
    • Current trading volume exceeds $2.5M on this specific prediction
    • Market participants show increased conviction in sustained bull run

    SPONSORED

    Maximize your gains with up to 100x leverage on perpetual contracts

    Trade Now on Defx

    Technical Analysis and Market Indicators

    Recent market data shows several bullish indicators supporting the prediction market sentiment:

    • RSI remains in healthy territory despite recent gains
    • Moving averages show strong upward momentum
    • Volume profiles indicate sustained institutional interest

    Frequently Asked Questions

    What factors could drive Bitcoin to $150,000?

    Institutional adoption, ETF inflows, and reduced selling pressure post-halving are key catalysts.

    When do analysts expect Bitcoin to reach $150,000?

    Most predictions point to Q3-Q4 2025, with some suggesting earlier timeframes based on current momentum.

    What are the main risks to this prediction?

    Regulatory changes, macroeconomic factors, and potential market manipulation could impact price trajectory.

    Market Implications and Trading Considerations

    As Bitcoin continues its upward trend, traders should consider:

    • Risk management strategies for high-volatility periods
    • Position sizing based on prediction market probabilities
    • Diversification across different crypto assets

    The growing confidence in Bitcoin’s potential to reach $150,000 reflects broader market optimism and institutional acceptance of cryptocurrency as a legitimate asset class.

  • Ethereum Price Dips to $2,500: Key Support Could Trigger Fresh Rally

    Ethereum Price Dips to $2,500: Key Support Could Trigger Fresh Rally

    Ethereum (ETH) is showing signs of a potential buying opportunity as the price corrects from recent highs, with key technical indicators suggesting strong support around the $2,500 level. Recent analysis of Ethereum’s MVRV ratio indicates significant upside potential despite the current dip.

    Technical Analysis Shows Bullish Pattern Formation

    The second-largest cryptocurrency by market cap recently tested the $2,720 resistance level before entering a correction phase. Key technical points include:

    • Price maintaining position above the crucial 100-hourly Simple Moving Average
    • Formation of a potential bullish flag pattern with resistance at $2,630
    • Strong support established at $2,500, coinciding with the 76.4% Fibonacci retracement level

    SPONSORED

    Trade ETH with up to 100x leverage and maximize your profit potential

    Trade Now on Defx

    Key Price Levels to Watch

    Traders should monitor these critical price levels:

    Level Type Price Point Significance
    Major Resistance $2,720 Previous high
    Immediate Resistance $2,630 Bullish flag resistance
    Key Support $2,500 Fibonacci level

    Market Indicators Signal Potential Reversal

    Technical indicators are showing mixed signals:

    • MACD: Losing bullish momentum but remains above signal line
    • RSI: Currently below 50, indicating potential oversold conditions
    • Moving Averages: Price holding above key EMAs suggests underlying strength

    Frequently Asked Questions

    What is causing the current Ethereum price dip?

    The current dip appears to be a technical correction following the recent push above $2,700, with profit-taking contributing to downward pressure.

    When might Ethereum resume its upward trend?

    Technical patterns suggest a potential reversal once the $2,500 support level is confirmed, with the bullish flag pattern indicating possible continuation.

    What are the key resistance levels to watch?

    Primary resistance levels are at $2,630, $2,720, and $2,820, with a break above these levels potentially triggering a rally toward $2,950.

    Conclusion and Outlook

    While Ethereum faces short-term pressure, the technical setup suggests a potential buying opportunity near $2,500. Traders should watch for confirmation of support and potential breakout signals above $2,630 for fresh long positions.

  • Bitcoin Bull Market Exit Strategy: 5 Key Signs To Sell at $150K-$200K

    The Bitcoin bull market has entered a critical phase as BTC surges past $100,000, prompting seasoned analysts to outline clear exit strategies. With recent price action showing both strength and potential warning signs, understanding when to take profits could be crucial for investors looking to maximize returns.

    Key Market Top Indicators to Watch

    Crypto strategist Ardizor has identified five critical signals that could indicate the optimal time to exit positions in this bull cycle:

    • BTC Profitability Index exceeding 300%
    • Widespread crypto discussion on social media platforms
    • Coinbase maintaining #1 position in app stores for 2+ months
    • BTC Coin Days Destroyed (CDD) metric surpassing 300 million
    • Mainstream retail FOMO indicators (taxi drivers discussing crypto)

    Strategic Portfolio Allocation

    For the current market phase, Ardizor recommends the following portfolio distribution:

    Asset Allocation
    Bitcoin (BTC) 40%
    Ethereum (ETH) 20%
    Quality Altcoins 10%
    Meme Coins 5%
    Working Capital 15%
    USDT (Dip Buying) 20%

    SPONSORED

    Trade Bitcoin with up to 100x leverage and maximize your bull market gains

    Trade Now on Defx

    Price Targets and Market Cycle Analysis

    Multiple analysts have converged on similar price targets for this cycle’s peak:

    • Peter Brandt: $125,000-$150,000 by August/September 2025
    • CrediBULL Crypto: Base case $150,000, extended target $200,000
    • Standard Chartered: $200,000 by year-end 2025

    Market Momentum and Capital Flows

    Recent data from Glassnode shows significant institutional interest, with $35 billion flowing into crypto markets in just three weeks. This surge in capital inflow coincides with Bitcoin’s breakthrough above $100,000, suggesting strong institutional conviction in the current rally.

    Frequently Asked Questions

    When is the best time to start taking profits?

    Experts recommend starting to scale out of positions when multiple top indicators align, rather than trying to time the exact peak.

    Should investors sell everything at once?

    A staged exit strategy is recommended, selling in tranches as different price targets are reached to minimize risk while maintaining upside exposure.

    What are the key risk factors to watch?

    Investors should monitor leverage levels, exchange outflows, and social sentiment indicators for signs of market exhaustion.

    At time of writing, Bitcoin trades at $103,600, maintaining strong momentum above the psychological $100,000 level.