Tag: Trading Volume

  • Bitcoin Breaks $110K: Market Cap Hits $2.19T in Historic Rally

    Key Takeaways:

    • Bitcoin reaches new milestone at $110,587
    • Total crypto market cap surges to $3.44 trillion
    • Bitcoin dominance stands at 63.8%

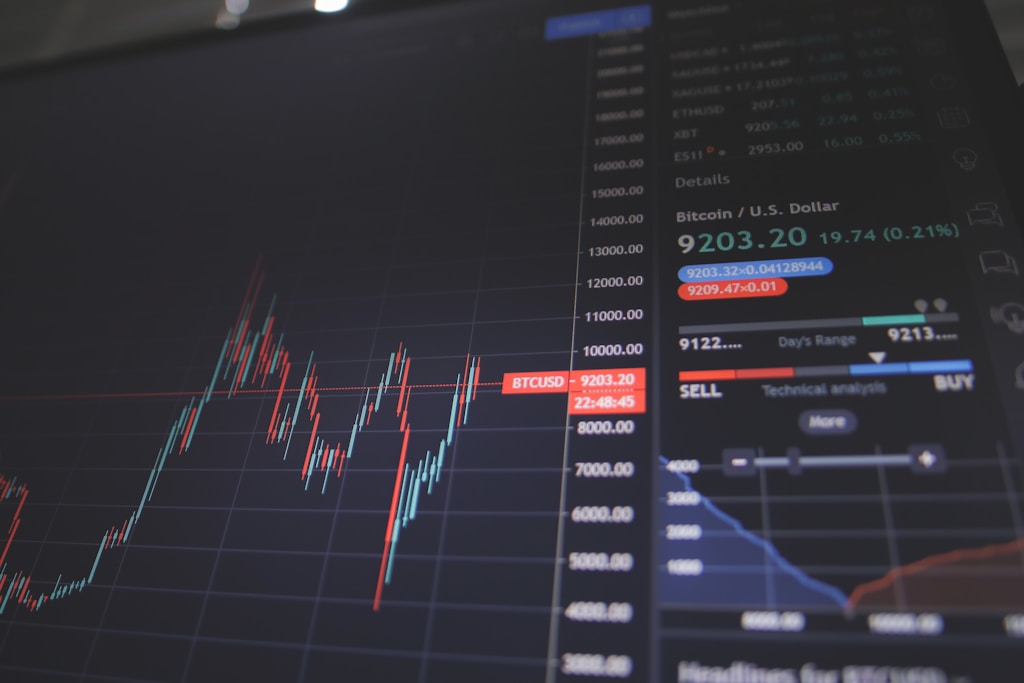
    In a remarkable display of market strength, Bitcoin (BTC) has shattered previous resistance levels, surging past $110,000 and reaching an intraday high of $110,587. This historic move follows last week’s dramatic surge that liquidated $81M in short positions, demonstrating the sustained momentum in the crypto market.

    The flagship cryptocurrency’s market capitalization has now reached an impressive $2.19 trillion, representing 63.8% of the total cryptocurrency market value of $3.44 trillion. This dominance ratio suggests Bitcoin’s continued role as the primary driver of crypto market movements.

    This latest price action appears to validate Cathie Wood’s bold prediction of Bitcoin reaching $710K, as institutional adoption continues to accelerate.

    SPONSORED

    Maximize your gains with up to 100x leverage on Bitcoin’s historic rally

    Trade Now on Defx

    Market Impact and Trading Volume

    The surge in Bitcoin’s price has been accompanied by a significant increase in trading volume, indicating strong market participation across both retail and institutional segments. This price movement represents a continuation of the bullish trend that began with the approval of spot Bitcoin ETFs.

    Expert Analysis

    Market analysts suggest that this breakthrough could signal the beginning of a new phase in Bitcoin’s bull market, with potential targets extending beyond the current levels. The strong market fundamentals and increasing institutional adoption continue to provide support for sustained price appreciation.

    FAQ Section

    Q: What’s driving Bitcoin’s current price surge?
    A: A combination of institutional adoption, strong market fundamentals, and increased trading volume are primary factors.

    Q: Is this price level sustainable?
    A: Market indicators suggest strong support levels, though volatility should be expected.

    Q: What’s the significance of Bitcoin’s current market dominance?
    A: At 63.8%, Bitcoin’s high market dominance indicates its continued role as the primary crypto market driver.

  • Bitcoin HODL Mode Intensifies as Exchange Volume Hits 2020 Lows

    Bitcoin investors are showing remarkable conviction as spot trading volume on centralized exchanges (CEX) plummets to levels not seen since October 2020, signaling a strong HODL mentality despite BTC hovering near all-time highs. This development comes as Bitcoin recently touched $107,000, suggesting accumulation rather than profit-taking.

    Key Highlights of Current Bitcoin Market Conditions

    • CEX spot trading volume at lowest point since October 2020
    • Bitcoin price holding steady at $107,200, up 1.33% in 24 hours
    • Technical indicators show strong support at $103,600
    • Key resistance level identified at $109,300

    Understanding the HODL Phenomenon

    The dramatic decrease in exchange volume indicates that Bitcoin holders are increasingly moving their assets off exchanges and into cold storage. This behavior typically signals strong conviction in Bitcoin’s long-term value proposition, particularly notable given the proximity to all-time highs around $112,000.

    SPONSORED

    Trade Bitcoin with up to 100x leverage and maximize your profit potential

    Trade Now on Defx

    Technical Analysis and Market Structure

    Bitcoin’s current price action shows remarkable resilience, maintaining position above several key moving averages:

    • 34-day EMA: $103,683
    • 50-day SMA: $101,906
    • 100-day SMA: $93,053

    Macroeconomic Factors

    While technical indicators remain bullish, several macroeconomic factors are influencing market sentiment:

    • US-China trade tensions
    • Global bond yield concerns
    • Inflation pressures
    • Tightening global liquidity

    Expert Analysis

    According to top analyst Axel Adler, the current market structure suggests accumulation rather than distribution: “The dramatic drop in exchange volume combined with steady price action near all-time highs indicates strong hands are continuing to accumulate rather than distribute their holdings.”

    Frequently Asked Questions

    Why is low exchange volume significant?

    Low exchange volume during price stability typically indicates that investors are holding rather than trading, suggesting strong conviction in the asset’s future value.

    What could trigger the next major move?

    A decisive break above $109,300 could trigger a new wave of momentum buying, while rejection at this level might lead to consolidation.

    How does this compare to previous HODL waves?

    The current HODL wave shows similarities to accumulation periods in 2020 and 2016, both of which preceded significant bull runs.

    As Bitcoin approaches key resistance levels, the coming days will be crucial in determining whether the reduced exchange volume translates into sustained upward momentum or leads to a period of consolidation.

  • Bitcoin Price Flexes at $105K: Technical Indicators Signal Further Upside

    Bitcoin Price Flexes at $105K: Technical Indicators Signal Further Upside

    Bitcoin’s price action continues to demonstrate remarkable strength as the leading cryptocurrency maintains its position above $105,000, with key technical indicators suggesting the current rally may have more room to run. Recent analysis had identified $97,000 as a critical support level, which BTC has convincingly cleared, setting up potential moves toward higher targets.

    Bitcoin’s Technical Strength Confirmed by Multiple Indicators

    According to analysis shared by Shaco AI on X (formerly Twitter), Bitcoin’s weekly chart is displaying impressive momentum, with BTC closing at $105,700. This positions the asset significantly above crucial moving averages, including the 25-week SMA at $95,009.55 and the 50-week SMA at $83,318.12.

    The technical picture is further reinforced by several key metrics:

    • RSI reading of 63.51 – indicating strong momentum without reaching overbought territory
    • MACD firmly in positive territory at 5835.33
    • Price maintaining position above both key SMAs

    Volume Analysis Raises Questions About Rally Sustainability

    Despite the bullish technical setup, trading volume has seen a notable decrease, with current levels at 95,302 compared to the average of 179,421. While recent price action has shown remarkable resilience, this volume divergence warrants careful monitoring.

    SPONSORED

    Maximize your trading potential with up to 100x leverage on perpetual contracts

    Trade Now on Defx

    Key Price Levels to Watch

    Traders should keep a close eye on these critical price levels:

    • Major resistance: $111,980
    • Strong support: $49,000
    • Current price: $105,700

    FAQ: Bitcoin’s Current Market Position

    What are the key resistance levels for Bitcoin?

    The immediate major resistance level sits at $111,980, which could determine the next significant move.

    Is Bitcoin currently overbought?

    With an RSI of 63.51, Bitcoin is showing strong momentum without entering overbought territory (typically above 70).

    What’s the significance of the current volume decline?

    The lower trading volume (95,302 vs 179,421 average) could indicate decreased market participation, potentially limiting short-term upside potential.

  • Bitcoin Net Taker Volume Plunges $155M After Trump-Musk Clash

    Bitcoin’s market dynamics took a dramatic turn as the largest cryptocurrency experienced unprecedented trading behavior following a high-profile clash between tech mogul Elon Musk and former President Donald Trump. The political confrontation triggered massive futures liquidations, leading to the most significant net taker volume decline of 2025.

    Record-Breaking Volume Shift Signals Market Fear

    According to renowned crypto analyst Darkfost, Binance’s net taker volume witnessed a historic plunge from +$20 million to -$135 million within just eight hours. This $155 million swing represents the largest directional shift in trader sentiment this year, highlighting the market’s heightened sensitivity to political developments.

    SPONSORED

    Trade Bitcoin with up to 100x leverage and maximize your profit potential

    Trade Now on Defx

    Technical Analysis: Critical Support Levels Hold

    Despite the sharp decline in market sentiment, Bitcoin has shown remarkable resilience at the crucial $100,000 support level. This key psychological level has remained intact for over 30 days, demonstrating strong buyer interest at these prices.

    Key Price Levels to Watch

    • Current Support: $103,600
    • Critical Resistance: $104,600 – $107,000 (EMA cluster)
    • Ultimate Target: $112,000 (All-time high)

    Market Implications and Future Outlook

    The dramatic shift in net taker volume suggests a potential short-term bearish trend, but historical data indicates such extreme sentiment reversals often precede significant price movements. Traders should monitor the $103,600 support level closely, as a decisive break below could trigger a retest of the $100,000 mark.

    FAQ

    What is net taker volume?
    Net taker volume measures the difference between aggressive buy and sell orders on an exchange, indicating market sentiment and potential price direction.

    Why did the Trump-Musk clash affect Bitcoin?
    The dispute centered around cryptocurrency regulation and market stability concerns, triggering risk-off sentiment among traders.

    What are the key levels to watch?
    Primary support lies at $103,600, with critical resistance between $104,600 and $107,000. The psychological $100,000 level remains crucial for maintaining bullish momentum.

  • PEPE Price Breakout: Technical Analysis Points to Major Rally Ahead

    PEPE Price Breakout: Technical Analysis Points to Major Rally Ahead

    The popular meme coin PEPE is showing strong bullish momentum after successfully breaking above a key resistance level, setting up what could be its next significant price advance. Technical analysts are closely watching this development as it could signal a broader shift in market sentiment for the token.

    Technical Breakout Confirms Bullish Structure

    According to respected crypto analyst UniChartz, PEPE has demonstrated remarkable strength by cleanly breaking through a critical resistance zone. This technical achievement is particularly noteworthy as it comes during a period of broader market uncertainty, similar to what we’ve seen with Dogecoin’s critical price levels.

    The breakout is currently undergoing a retest of the previous resistance level, which is now acting as support – a classic technical pattern that often precedes continued upward movement. This price action is being supported by multiple technical factors:

    • A well-established rising trendline providing dynamic support
    • Multiple successful tests of the support level
    • Strong confluence between horizontal and diagonal support zones
    • Increasing trading volume supporting the breakout

    Volume Analysis Supports Bullish Thesis

    Perhaps most significantly, trading volume metrics are lending credibility to this technical setup. Whales_Crypto_Trading has highlighted that PEPE’s breakout from its descending channel was accompanied by notably high volume – a key indicator that large market participants may be accumulating positions.

    SPONSORED

    Trade meme coins like PEPE with up to 100x leverage on perpetual contracts

    Trade Now on Defx

    Key Levels to Watch

    For traders looking to capitalize on this setup, several critical price levels deserve attention:

    • Current Support: The breakout retest zone
    • Rising Trendline: Providing dynamic support
    • Volume Profile: Shows significant buyer interest at current levels

    Frequently Asked Questions

    What makes this PEPE breakout significant?

    This breakout is particularly notable because it combines multiple technical factors: strong volume, clear support levels, and a well-defined trend structure.

    What could invalidate this bullish setup?

    A decisive break below the current support zone and rising trendline would likely invalidate the bullish thesis.

    How does this compare to previous PEPE rallies?

    The current setup shows stronger technical foundations compared to previous moves, with better volume support and clearer price structure.

  • Bitcoin Long-Term Holder Confidence Soars: $20B Realized Cap Milestone

    Bitcoin Long-Term Holder Confidence Soars: $20B Realized Cap Milestone

    Bitcoin’s underlying strength continues to build as long-term holder (LTH) confidence reaches new heights, with the LTH Net Position Realized Cap surpassing $20 billion. This key on-chain metric, combined with significant exchange outflows and rising spot market dominance, suggests a potentially bullish continuation of the current uptrend.

    As Bitcoin defends the crucial $105,000 support level, on-chain data reveals mounting evidence of accumulation by seasoned investors. The flagship cryptocurrency currently trades at $105,022, showing remarkable resilience despite recent market volatility.

    Long-Term Holder Metrics Signal Growing Confidence

    According to CryptoQuant data, several bullish indicators have emerged since early June:

    • LTH Net Position Realized Cap exceeds $20 billion
    • Over 20,000 BTC withdrawn from major exchanges in 48 hours
    • Binance spot trading dominance increased from 26% to 35%

    These metrics are particularly significant as LTHs, defined as entities holding Bitcoin for more than 155 days, are often considered “smart money” investors who maintain conviction through market volatility.

    SPONSORED

    Trade Bitcoin with up to 100x leverage on perpetual contracts

    Trade Now on Defx

    Exchange Outflows Signal Strong HODLing Sentiment

    The substantial withdrawal of Bitcoin from exchanges suggests a shift toward long-term holding strategies. When investors move BTC to private wallets, it typically indicates reduced selling pressure and increased confidence in future price appreciation.

    Market Indicators and Future Outlook

    While the overall trend appears bullish, some caution is warranted. Recent data shows declining retail demand despite Bitcoin’s elevated price levels. However, neutral funding rates and subdued selling pressure provide a balanced foundation for potential future growth.

    Frequently Asked Questions

    What is the LTH Net Position Realized Cap?

    This metric measures the total value of Bitcoin held by long-term holders based on the price when the coins were last moved, indicating the cost basis of experienced investors.

    Why are exchange outflows considered bullish?

    Large withdrawals from exchanges typically indicate that investors plan to hold their Bitcoin long-term rather than sell, reducing available supply and potentially driving up prices.

    What role does Binance’s spot market dominance play?

    Increased spot market dominance on major exchanges like Binance often signals growing legitimate trading activity versus speculative derivatives trading.

  • Bitcoin Retail Demand Drops Despite $105K Price Level – Key Metrics Show Bearish Shift

    Bitcoin Retail Demand Drops Despite $105K Price Level – Key Metrics Show Bearish Shift

    Recent on-chain data reveals a surprising trend in Bitcoin’s market dynamics – retail investor demand is declining despite BTC maintaining price levels above $105,000. This analysis explores the key metrics behind this unexpected market behavior and what it means for Bitcoin’s near-term outlook.

    Retail Investor Activity Shows Concerning Decline

    According to data from CryptoQuant, retail investor demand for Bitcoin has entered negative territory on a 30-day change basis, marking a significant shift in market sentiment. This metric, which tracks transaction volumes under $10,000, serves as a key indicator of small investor participation in the market.

    The decline comes at a particularly interesting time, as it coincides with Bitcoin’s continued defense of the $105,000 support level, suggesting a potential disconnect between price action and retail participation.

    Key Findings from the Data:

    • Retail transaction volume has declined significantly since Bitcoin’s recent all-time high
    • Current retail demand levels are lower than during the late 2024 rally
    • Small investor participation failed to match previous bull market peaks

    SPONSORED

    Trade Bitcoin with up to 100x leverage and maximize your profit potential

    Trade Now on Defx

    Miner Activity Hits Multi-Year Low

    Adding to the bearish signals, data from Sentora (formerly IntoTheBlock) shows Bitcoin miner volume share has dropped to its lowest level since 2022. This reduction in miner activity could indicate potential shifts in network dynamics and selling pressure.

    Market Implications and Future Outlook

    While Bitcoin maintains its position near all-time highs, the declining retail participation raises questions about market sustainability. Recent data showing increased whale accumulation suggests institutional investors may be offsetting reduced retail demand.

    FAQ Section

    Why is retail demand declining despite high prices?

    The decline may be attributed to profit-taking following the all-time high and potential market exhaustion among smaller investors.

    What does reduced miner activity mean for Bitcoin?

    Lower miner volume could indicate reduced selling pressure, potentially supporting price stability despite decreased retail participation.

    Could this lead to a market correction?

    While declining retail demand is concerning, strong institutional support and whale accumulation may help maintain current price levels.

  • Meme Coins Surge 25%: MIND of Pepe, Solaxy Lead June Rally

    Meme Coins Surge 25%: MIND of Pepe, Solaxy Lead June Rally

    The meme coin market has kicked off June with explosive momentum, recording a 25% surge in trading volume and 5% increase in total market capitalization over the past 24 hours. This rally comes as several highly anticipated new meme coin projects prepare for launch, potentially signaling the start of a major market movement.

    Leading the charge are two innovative projects that blend meme coin appeal with practical utility: MIND of Pepe ($MIND) and Solaxy ($SOLX). MIND of Pepe’s presale has already reached $12.6M, demonstrating strong investor confidence in its AI-powered trading insights platform.

    SPONSORED

    Trade meme coins with up to 100x leverage on perpetual contracts

    Trade Now on Defx

    Market Analysis: Why June Could Be Critical

    Several key factors are aligning to suggest significant upside potential for meme coins this month:

    • 25% increase in trading volume across major meme coins
    • 5% growth in total market capitalization
    • High-profile launches including MIND of Pepe and Solaxy
    • Increased institutional interest in crypto markets

    New Projects Driving Innovation

    The standout projects garnering attention include:

    MIND of Pepe ($MIND)

    Combining AI capabilities with meme coin dynamics, MIND of Pepe represents a new generation of utility-focused meme tokens. The project has raised over $12.6M in its presale phase, with investors particularly excited about its AI-powered trading insights platform.

    Solaxy ($SOLX)

    As Solana’s first Layer 2 solution, Solaxy aims to solve scalability issues while maintaining the network’s high speed and low costs. The project has secured $43.5M in early funding, suggesting strong market confidence.

    Market Outlook and Risk Factors

    While the current momentum is strong, investors should consider several risk factors:

    • Historical volatility in meme coin markets
    • Regulatory uncertainty
    • Market correlation with broader crypto trends

    FAQ Section

    What’s driving the current meme coin rally?

    The surge is attributed to increased trading volume, new project launches, and growing institutional interest in the crypto sector.

    How can investors participate in these new projects?

    Investors can participate through presales, exchange listings, and DeFi platforms, though thorough research is essential before investing.

    What are the key risks to consider?

    Major risks include market volatility, regulatory changes, and the speculative nature of meme coins.

  • Bitcoin Price Cools at $109K: Moving Averages Signal Bullish Momentum

    Key Takeaways:

    • Bitcoin trades at $108,972 with $33.16B 24-hour volume
    • Market cap holds steady at $2.16 trillion
    • Technical indicators maintain bullish bias despite cooling momentum

    Bitcoin’s price action showed signs of cooling on May 28, 2025, as the leading cryptocurrency traded within a tight range between $108,568 and $110,407. This consolidation phase comes after Bitcoin’s recent test of key support at $108K, suggesting a period of price discovery before the next major move.

    The flagship cryptocurrency maintained its position above the crucial $108,000 support level, demonstrating resilience despite decreased momentum. The current market structure aligns with recent analysis showing potential for a rally toward $130,000 based on golden ratio projections.

    Technical Analysis

    Moving averages on multiple timeframes continue to signal bullish momentum:

    • 20-day EMA: Strong support at $107,250
    • 50-day MA: Upward slope maintains bullish trend
    • 200-day MA: Long-term uptrend intact at $95,680

    Market Sentiment

    Trading volume has seen a slight decrease, with the 24-hour figure settling at $33.16 billion. This cooling period follows significant institutional activity, including recent ETF inflows of $420 million.

    SPONSORED

    Maximize your trading potential with up to 100x leverage on perpetual contracts

    Trade Now on Defx

    FAQ

    Q: What’s causing Bitcoin’s current price consolidation?
    A: The market is digesting recent gains and institutional inflows while maintaining key support levels.

    Q: Could Bitcoin still reach $115K in the near term?
    A: Technical indicators and moving averages suggest continued bullish momentum despite temporary cooling.

    Q: What key levels should traders watch?
    A: Primary support remains at $108,000, with resistance at $110,400.

  • Hyperliquid (HYPE) Surges 50% to $39 ATH on Record Trading Volume

    Hyperliquid’s native HYPE token has skyrocketed to a new all-time high of $39, marking an impressive 50% surge amid broader market uncertainty. The DeFi perpetual trading platform continues to demonstrate remarkable growth, with key metrics pointing to sustained momentum.

    Record-Breaking Performance Metrics

    In a remarkable display of platform adoption, Hyperliquid has shattered several records in May 2025. The platform achieved:

    • Weekly trading volume of $78.672 billion (May 11-18)
    • Peak daily volume of $17.731 billion on May 21
    • Cumulative trading volume surpassing $1.156 trillion
    • Open interest reaching $10.1 billion (new ATH)
    • $3.5 billion in USDC locked on the platform

    Institutional Interest Driving Growth

    The platform’s meteoric rise has been fueled by increasing institutional adoption, particularly highlighted by James Wynn’s billion-dollar positions. This high-profile trading activity has attracted significant attention from both retail and institutional investors. As broader crypto market momentum builds toward new highs, Hyperliquid has emerged as a preferred venue for sophisticated traders.

    SPONSORED

    Trade perpetual contracts with up to 100x leverage on the most advanced DEX

    Trade Now on Defx

    Revenue Generation and Platform Growth

    The platform’s fee generation has been equally impressive:

    • $5.6 million in fees generated in 24 hours
    • $22 million in weekly fee revenue
    • Daily trading volumes consistently above $2 billion

    Whale Activity and Price Action

    Recent whale movements have added momentum to HYPE’s price action:

    • Three major whales invested $5.33 million in HYPE tokens
    • Daily trading volume reached $460 million on May 26
    • Strong buying pressure suggesting continued upside potential

    FAQ Section

    What is driving Hyperliquid’s growth?

    The platform’s growth is primarily driven by increasing institutional adoption, record-breaking trading volumes, and strong revenue generation from fees.

    Is HYPE’s price increase sustainable?

    Current metrics suggest strong fundamental support for the price increase, with growing trading volumes and increasing platform adoption indicating potential for continued growth.

    How does Hyperliquid compare to other DeFi platforms?

    Hyperliquid has established itself as a leading DeFi perpetual trading platform, with over $1.156 trillion in cumulative trading volume and consistent daily volumes exceeding $2 billion.

    As the platform continues to set new records and attract institutional interest, the outlook for HYPE remains bullish. However, investors should maintain proper risk management practices given the volatile nature of cryptocurrency markets.