Tag: Trading Volume

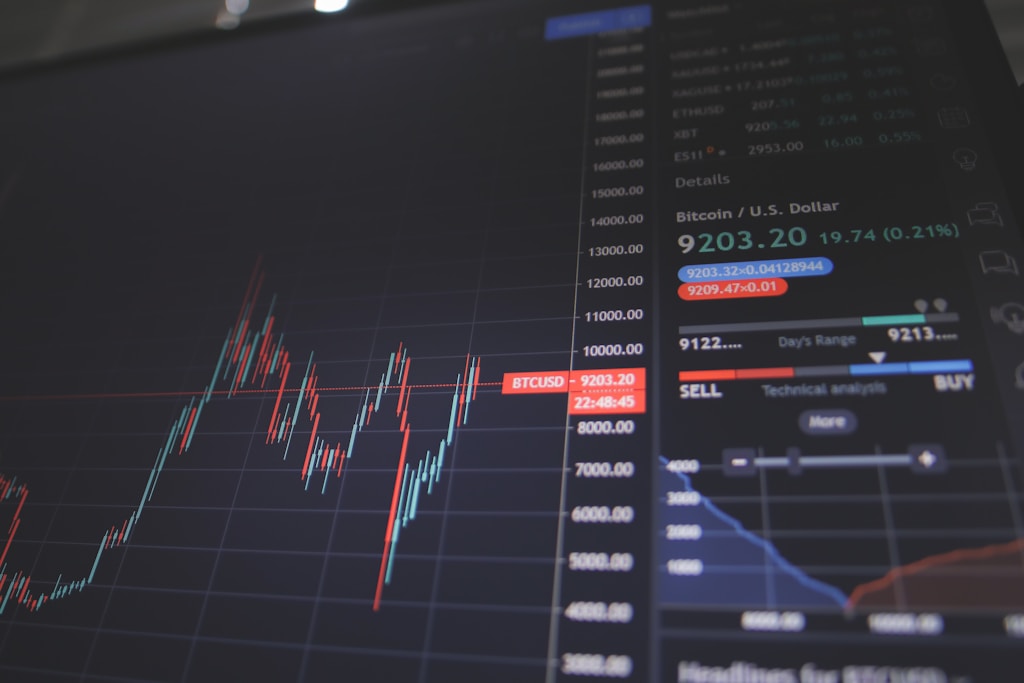
  • Bitcoin Price Rally Shows Weakness as Spot Volume Plunges 35%

    Bitcoin Price Rally Shows Weakness as Spot Volume Plunges 35%

    Bitcoin’s recent surge to new all-time highs above $110,000 may be showing signs of fragility, according to concerning market data that reveals a significant decline in spot trading volume. This analysis comes as BTC continues testing historical highs amid lagging altcoin performance.

    Key Market Indicators Flash Warning Signs

    On-chain analyst Darkfost has identified a potentially troubling trend in Bitcoin’s market structure. According to data from Binance, while futures trading activity has seen modest gains since May 5, spot market volume has experienced a notable decline. This divergence between futures and spot markets often precedes increased volatility.

    SPONSORED

    Trade Bitcoin with up to 100x leverage on perpetual contracts

    Trade Now on Defx

    Understanding the Volume Metrics

    Two critical metrics are at play:

    • Daily Binance Future Trade Volume: Shows increasing short-term speculative activity
    • Spot Trading Volume: Indicates declining long-term investor participation

    This imbalance suggests that current price action is being driven more by leveraged speculation than genuine spot demand, creating potential instability in the market. As some analysts project ambitious price targets, this underlying weakness demands attention.

    Market Impact and Risk Assessment

    The current market dynamics present several key risks:

    • Increased volatility potential due to leveraged positions
    • Reduced support from spot buyers during pullbacks
    • Higher likelihood of sharp price corrections

    Current Price Action and Outlook

    Bitcoin currently trades at $107,770, showing modest 24-hour gains of 0.2%. While the weekly performance remains positive at 4%, the declining spot volume suggests caution is warranted for both short and medium-term positions.

    FAQ

    Q: Why is spot volume important for Bitcoin’s price stability?
    A: Spot volume represents real demand from long-term investors, providing stronger price support than leveraged futures trading.

    Q: What could trigger a market correction?
    A: A lack of spot buying support combined with overleveraged futures positions could lead to cascading liquidations if price support levels break.

    Q: How can traders protect themselves in this environment?
    A: Consider reducing leverage, maintaining strict stop losses, and watching for signs of spot volume recovery before taking large positions.

  • Bitcoin Price Drops Below $108K – Moving Averages Signal Bear Market Return

    Bitcoin Price Drops Below $108K – Moving Averages Signal Bear Market Return

    Bitcoin (BTC) is showing signs of weakness as it trades below critical moving averages, potentially signaling a return to bearish market conditions. According to technical analysis from Shaco AI, BTC is currently trading at $107,750, struggling to maintain momentum above key technical levels.

    Critical Moving Average Analysis Shows Bearish Pressure

    The leading cryptocurrency has fallen below both the 25-hour simple moving average (SMA) at $109,245 and the 50-hour SMA at $110,192, suggesting mounting selling pressure. This technical setup aligns with recent analysis showing Bitcoin’s rejection at the $112K all-time high, indicating bears may be regaining control.

    SPONSORED

    Trade Bitcoin with up to 100x leverage on perpetual contracts

    Trade Now on Defx

    Technical Indicators Paint Cautious Picture

    Key technical indicators are flashing warning signs:

    • RSI at 36.53 – approaching oversold territory
    • MACD at -755.12 – confirming strong bearish momentum
    • ADX at 37.85 – indicating a strong directional trend
    • Trading volume down to $383.4B from $1.425.44T average

    Critical Support and Resistance Levels

    Traders should watch these key price levels:

    • Resistance: $111,980
    • Current Price: $107,750
    • Support: $106,800

    Expert Analysis and Market Outlook

    The significant drop in trading volume, currently at just $383.4 billion compared to the recent average of $1.425.44 trillion, suggests market participants are taking a cautious approach. This aligns with recent data showing changing institutional investment patterns in Bitcoin ETFs.

    FAQ Section

    Is Bitcoin entering a bear market?

    While current indicators show bearish pressure, it’s too early to confirm a full bear market. The price remains above key support levels and institutional interest remains strong.

    What are the key levels to watch?

    The immediate support level at $106,800 is crucial. A break below could trigger further selling, while resistance at $111,980 needs to be cleared for bullish continuation.

    How significant is the current volume decrease?

    The 73% drop in trading volume is significant and could indicate a lack of conviction in the market direction, potentially preceding a major move.

  • Ethereum Price Shows Overheating Signs at $2,500 – Pullback Incoming?

    Ethereum (ETH) is showing signs of market exhaustion as it hovers near the critical $2,500 level, with multiple indicators suggesting a potential short-term correction could be on the horizon. Technical analysts are closely monitoring volume patterns and price action that hint at an overheated market condition.

    Market Analysis Reveals Overheating Signals

    According to recent data from CryptoQuant, Ethereum’s trading volume patterns have shifted dramatically over the past month. The analysis reveals a concerning transition from ‘Cooling’ to ‘Overheating’ status, suggesting the current rally may be approaching unsustainable levels. This shift coincides with Ethereum’s strong support at $2,450, though maintaining these levels may prove challenging in the short term.

    SPONSORED

    Trade ETH with up to 100x leverage on perpetual contracts

    Trade Now on Defx

    Key Technical Indicators

    The Market Value to Realized Value (MVRV) ratio, a key metric for assessing market conditions, suggests ETH must maintain support above $2,200 to preserve its bullish momentum. Veteran analyst Ali Martinez emphasizes this level as crucial for potential upside targets of $3,000 to $4,000.

    Expert Price Predictions

    Multiple analysts have weighed in on Ethereum’s price trajectory:

    • Ted Pillows identifies a Golden Cross formation on the 12-hour chart
    • Technical analysis suggests a potential move to $4,000 within the established symmetrical triangle
    • Contrarian view from Gianni Pichichero warns of possible retracement to $2,350

    FAQ Section

    What’s causing Ethereum’s current market overheating?

    The overheating condition is primarily attributed to increased trading volume and significant profit-taking at the $2,500 resistance level, combined with a 59.7% price surge over the past month.

    What are the key support levels to watch?

    The critical support level is $2,200, with secondary support at $2,350. These levels will be crucial for maintaining bullish momentum.

    What’s the potential upside target if support holds?

    If current support levels hold, analysts project potential targets of $3,000 in the near term, with some suggesting $4,000 as a longer-term target.

    Time to read: 5 minutes

  • Bitcoin Price Holds $105K: Key Support Levels Signal Market Direction

    Reading Time: 8 minutes

    Bitcoin’s price maintains a strong position above $105,000 as market participants closely monitor critical support levels that could determine the next major move. As of May 20, 2025, Bitcoin trades at $105,311, demonstrating remarkable resilience amid increased market volatility.

    Market Overview: Bitcoin’s Current Position

    The leading cryptocurrency has established a significant presence in the six-figure territory, with current metrics showing:

    • Current Price: $105,311
    • Market Capitalization: $2.09 trillion
    • 24-hour Trading Volume: $36.50 billion
    • Daily Range: $102,425 – $106,704

    This price action follows Bitcoin’s recent achievement of the $106K milestone, suggesting continued bullish momentum despite short-term fluctuations.

    Technical Analysis: Support and Resistance Levels

    The current market structure reveals several critical levels that traders should monitor:

    Support Levels Resistance Levels
    $102,400 $106,700
    $100,000 $108,500
    $98,500 $110,000

    SPONSORED

    Trade Bitcoin with up to 100x leverage and maximize your profit potential

    Trade Now on Defx

    Market Sentiment and Volume Analysis

    Recent data from Bitcoin’s Fear & Greed Index suggests increasing optimism, though traders should remain cautious of potential overextension.

    Frequently Asked Questions

    Q: Will Bitcoin maintain the $105K level?

    Current market indicators suggest strong support at this level, backed by institutional buying and positive market sentiment.

    Q: What are the key resistance levels to watch?

    The immediate resistance lies at $106,700, with major psychological resistance at $110,000.

    Q: How does current volume compare to previous rallies?

    The $36.50 billion daily volume indicates healthy market participation, though slightly below recent peaks.

    Looking Ahead: Market Implications

    As Bitcoin continues to trade above $105,000, market participants should monitor volume profiles and institutional flows for signs of sustained momentum or potential reversal signals.

  • Bitcoin Price Nears $105K as Spot Demand Shows Healthy Growth Pattern

    Bitcoin (BTC) continues to demonstrate remarkable resilience in its latest market cycle, trading at $104,820 after touching a 24-hour peak of $106,518. While showing a minor 0.5% retracement, the leading cryptocurrency maintains its strong position just 3.8% below its January all-time high of $109,000, suggesting sustained bullish momentum.

    As highlighted in recent market analysis showing Bitcoin’s healthy rally pattern, the current price action reflects a measured advance rather than speculative excess.

    Binance Spot Volume Analysis Reveals Strengthening Fundamentals

    CryptoQuant analyst Darkfost’s latest research reveals a significant shift in market dynamics, with Binance’s spot net volume delta returning to positive territory. This key metric, measuring the differential between buying and selling pressure, indicates renewed accumulation at current levels.

    SPONSORED

    Trade Bitcoin with up to 100x leverage on perpetual contracts

    Trade Now on Defx

    MVRV Analysis Signals Potential Short-Term Risks

    A complementary analysis from CryptoQuant’s Crazzyblockk examines the MVRV momentum divergence between long-term and short-term holders. While both cohorts maintain profitable positions, the declining weekly MVRV momentum among recent market entrants warrants attention.

    Market Outlook and Risk Assessment

    Despite emerging short-term risk signals, Bitcoin’s broader market structure remains robust. Recent data showing Bitcoin’s realized cap reaching $906B further supports the thesis of sustainable growth.

    Key Factors to Monitor:

    • Spot volume trends on major exchanges
    • MVRV momentum divergence
    • Long-term holder behavior
    • Short-term price support levels

    The market appears positioned for continued strength, provided current support levels hold and risk signals remain contained.

  • XRP Price Faces Double Rejection at $2.65 – Critical Support at $2.37

    XRP Price Faces Double Rejection at $2.65 – Critical Support at $2.37

    XRP’s price action has hit a critical juncture after facing two consecutive rejections at key resistance levels, potentially signaling a shift in market momentum. Recent analysis had shown XRP holding strong support at $2.48, but the latest price action suggests increasing selling pressure at higher levels.

    Technical Analysis Shows Weakening Momentum

    Market analyst Andrew Griffiths has identified a concerning pattern in XRP’s recent price movement, with rejections occurring at $2.65 and $2.57 respectively. The secondary rejection at a lower level indicates growing seller confidence and could forecast further downside pressure.

    A critical divergence between price and volume metrics has emerged as XRP tests these resistance levels. While prices attempted to push higher, trading volume has shown a marked decrease – a classic warning sign that typically precedes price corrections.

    SPONSORED

    Trade XRP with up to 100x leverage on perpetual contracts

    Trade Now on Defx

    Key Support Levels to Watch

    The immediate focus turns to the $2.37 support level, which has previously demonstrated strong buying interest. A break below this level could trigger a cascade of selling pressure, potentially leading to a deeper retracement.

    RSI Indicates Potential Upside

    Despite the bearish signals, the Relative Strength Index (RSI) remains in favorable territory, suggesting that bulls haven’t completely lost control. This technical indicator continues to show potential for upward movement, particularly if XRP can overcome current resistance levels.

    FAQ Section

    Q: What are the key resistance levels for XRP?
    A: The primary resistance levels are at $2.65 and $2.57, with both showing recent rejection patterns.

    Q: Where is the critical support level?
    A: The key support level to watch is $2.37, which has historically provided strong price support.

    Q: What does the volume analysis suggest?
    A: Decreasing volume during price increases suggests weakening bullish momentum and potential for a price correction.

    Market Outlook

    The current market structure presents a mixed picture for XRP traders. While technical indicators show some bullish potential, the recent rejection patterns and volume analysis suggest caution. Traders should watch the $2.37 support level closely, as it could determine the next major price movement.

  • Dogecoin Open Interest Surges 64% Despite Price Dip: Market Analysis

    Dogecoin Open Interest Surges 64% Despite Price Dip: Market Analysis

    The Dogecoin (DOGE) derivatives market is showing remarkable resilience as futures open interest continues climbing despite recent price corrections. Data from analytics firm Glassnode reveals a significant 64% surge in open interest over the past week, signaling sustained speculative activity in the popular memecoin.

    Unprecedented Growth in Dogecoin Futures Market

    According to Glassnode’s latest analysis, Dogecoin’s futures open interest has skyrocketed from $989 million to $1.62 billion in just seven days. This dramatic increase comes as DOGE tests critical price levels near $0.25, suggesting growing investor confidence despite market volatility.

    SPONSORED

    Trade Dogecoin with up to 100x leverage on perpetual contracts

    Trade Now on Defx

    Understanding the Market Dynamics

    The sustained growth in futures open interest, even as DOGE experiences price pullbacks, indicates several key market dynamics:

    • Increased speculative positioning despite cooling price momentum
    • Growing institutional interest in Dogecoin derivatives
    • Potential for increased price volatility due to leveraged positions

    Broader Market Impact

    This trend isn’t isolated to Dogecoin. XRP has witnessed similar growth, with its futures open interest climbing 41.6% to reach $3.4 billion. Recent analysis shows XRP’s price strength persisting despite market uncertainties.

    Expert Analysis and Market Outlook

    Market analysts suggest this decoupling between price action and futures interest could indicate:

    • Growing confidence in DOGE’s long-term potential
    • Increased sophistication in crypto derivatives trading
    • Potential for significant price movements in the near term

    FAQ Section

    What does increasing futures open interest mean?

    Rising futures open interest indicates more traders are opening positions, suggesting increased market participation and potential volatility.

    Why is Dogecoin seeing increased derivatives activity?

    The surge in activity likely stems from growing institutional interest and improved market infrastructure for crypto derivatives trading.

    What could this mean for DOGE price?

    Higher open interest typically leads to increased volatility, potentially setting up significant price movements in either direction.

    Current Market Status

    As of this writing, Dogecoin trades at $0.236, marking a 42% increase over the past week. The continued rise in futures open interest, despite recent price corrections, suggests strong market interest in DOGE’s future price movement.

  • Bitcoin Price Holds $88K Support: Key Metrics Signal $90K Breakout

    Bitcoin Price Holds $88K Support: Key Metrics Signal $90K Breakout

    Key Takeaways:

    • Bitcoin maintains strong support at $88,447 with $1.75T market cap
    • 24-hour trading range: $86,664 to $88,874
    • Trading volume reaches $36.36B amid consolidation phase

    Bitcoin’s price continues to demonstrate remarkable resilience at the crucial $88K support level, as the leading cryptocurrency maintains its position near all-time highs. As recent market analysis showed strengthening support levels above $84K, the current consolidation phase suggests accumulation before a potential push to $90,000.

    Market Analysis: Technical Indicators Point to Bullish Continuation

    The cryptocurrency’s current trading pattern exhibits several bullish indicators:

    • Market capitalization: $1.75 trillion
    • 24-hour trading volume: $36.36 billion
    • Price consolidation range: $86,664 – $88,874

    SPONSORED

    Trade Bitcoin with up to 100x leverage and maximize your profit potential

    Trade Now on Defx

    Volume Analysis and Market Sentiment

    The substantial trading volume of $36.36 billion indicates strong market participation, despite the relatively tight trading range. This pattern often precedes significant price movements, particularly when coupled with holding patterns at key psychological levels like $88K.

    Expert Outlook and Price Projections

    Market analysts remain optimistic about Bitcoin’s short-term prospects, with several key factors supporting a potential breakout above $90,000:

    • Strong institutional support
    • Decreasing exchange reserves
    • Robust technical support at $88K

    Frequently Asked Questions

    Q: What’s driving Bitcoin’s current price stability?
    A: The stability at $88K is supported by strong institutional holding patterns and reduced selling pressure.

    Q: When could Bitcoin break $90K?
    A: Technical indicators suggest a breakout could occur within the next 24-48 hours if current support levels hold.

    Q: What are the key resistance levels above $88K?
    A: Major resistance zones exist at $89,500 and $90,000, with additional psychological barriers at $92,000.

    Conclusion

    As Bitcoin maintains its position above $88K, the market structure suggests a potential surge toward $90,000 could be imminent. Traders should monitor volume patterns and order book depth for confirmation of the next major move.

  • Bitcoin Volume Dominance Shifts to US Exchanges: Key Price Signal Emerges

    Bitcoin Volume Dominance Shifts to US Exchanges: Key Price Signal Emerges

    Recent on-chain data reveals a significant shift in Bitcoin trading dynamics, with US-based cryptocurrency exchanges regaining volume dominance. This development could signal a major price movement ahead, as similar patterns historically preceded notable rallies.

    Understanding the US vs. Off-Shore Trading Ratio

    According to CryptoQuant analyst Axel Adler Jr, the US vs. Off-Shore Ratio has shown a notable reversal pattern. This critical metric measures the relationship between Bitcoin trading volumes on American exchanges compared to international platforms. A ratio exceeding 1.0 indicates US exchange dominance, while values below this threshold suggest higher activity on offshore platforms.

    This shift in trading dynamics comes as Bitcoin continues to hold strong above $83,000, demonstrating remarkable market resilience despite recent volatility.

    Key Market Developments

    • Sharp increase in US exchange volume dominance throughout 2023
    • Sustained trading activity above the crucial 1.0 ratio threshold
    • Recent reversal pattern showing similarities to previous bullish setups

    SPONSORED

    Trade Bitcoin with up to 100x leverage and maximize your profit potential

    Trade Now on Defx

    Technical Analysis and Future Outlook

    The current market structure shows striking similarities to the previous reversal pattern that occurred when Bitcoin traded around $60,000. That instance preceded a significant rally to new all-time highs. However, traders should note that confirmation requires a crossover between the 90-day and 365-day simple moving averages (SMAs).

    Frequently Asked Questions

    What does increased US exchange dominance mean for Bitcoin?

    Historically, periods of US exchange dominance have corresponded with increased institutional participation and regulatory clarity, often leading to more sustainable price appreciation.

    How does this metric compare to previous bull markets?

    The current ratio levels mirror patterns seen during the 2021 bull run, suggesting potential for similar upward momentum.

    What are the key levels to watch?

    The critical threshold remains at the 1.0 ratio level, with particular attention to the pending SMA crossover for trend confirmation.

    As Bitcoin maintains its position above $84,000 with a 10% weekly gain, market participants should closely monitor these volume dynamics for potential trend confirmation. The convergence of technical indicators and volume metrics could signal the next major move in the cryptocurrency market.

  • Coinbase Stock Plunges 30% as Trump Tariff Fears Shake Crypto Markets

    Coinbase Stock Plunges 30% as Trump Tariff Fears Shake Crypto Markets

    Coinbase (COIN) faces significant headwinds as President Trump’s fluctuating tariff policies cast a shadow over retail crypto trading activity, according to a new Oppenheimer report that has slashed revenue forecasts for the leading U.S. crypto exchange. This follows broader market uncertainty around U.S. tariff policies that continues to impact crypto markets.

    Key Takeaways:

    • Trading volume forecast cut by 19% to $1.3 trillion for full year
    • Q1 estimate reduced to $380 billion, down 13% quarter-over-quarter
    • Stock price target lowered from $388 to $279
    • Coinbase maintains 69% market share of U.S. spot trading

    SPONSORED

    Trade crypto with up to 100x leverage on perpetual contracts

    Trade Now on Defx

    Market Impact Analysis

    Despite an increasingly crypto-friendly regulatory environment in Washington, retail participation remains subdued. Coinbase stock has underperformed both Bitcoin (down 10%) and the S&P 500 (down 8%) this year, highlighting the platform’s vulnerability to macro uncertainties.

    Market Share Strength

    A silver lining emerges in Coinbase’s dominant market position, commanding 69% of U.S. spot trading volume in February. This represents significant gains against competitors like Robinhood, though maintaining this advantage will depend on market recovery.

    Expert Outlook

    “As a focused leader in crypto with optionality in tokenization and payments use cases, we believe COIN can command a premium,” notes Oppenheimer analyst Owen Lau, maintaining an outperform rating despite near-term challenges.

    FAQ Section

    How has Coinbase stock performed in 2025?

    Coinbase stock has fallen 30% year-to-date, underperforming both Bitcoin and the broader market.

    What is Coinbase’s current market share?

    Coinbase holds 69% of U.S. spot crypto trading volume as of February 2025.

    What is Oppenheimer’s new price target for Coinbase?

    Oppenheimer has lowered its price target from $388 to $279 while maintaining an outperform rating.

    Looking Ahead

    While current market conditions present challenges, Oppenheimer remains optimistic about Coinbase’s long-term potential, particularly if tariff tensions ease. The exchange’s strong market position and diverse revenue streams could support a recovery once macro conditions improve.