Tag: Trading Volume

  • Bitcoin Bull Cycle Peak? Volume Ratio Analysis Signals Critical Phase

    Bitcoin Bull Cycle Peak? Volume Ratio Analysis Signals Critical Phase

    Bitcoin’s recent price action has sparked intense debate about whether the current bull cycle is approaching its peak, with the leading cryptocurrency showing uncertain momentum after hitting its all-time high of $109,000 in January 2024. Recent supply ratio analysis had suggested a potential $90K breakout, but new volume metrics paint a more complex picture.

    Volume Ratio Analysis Reveals Cycle Patterns

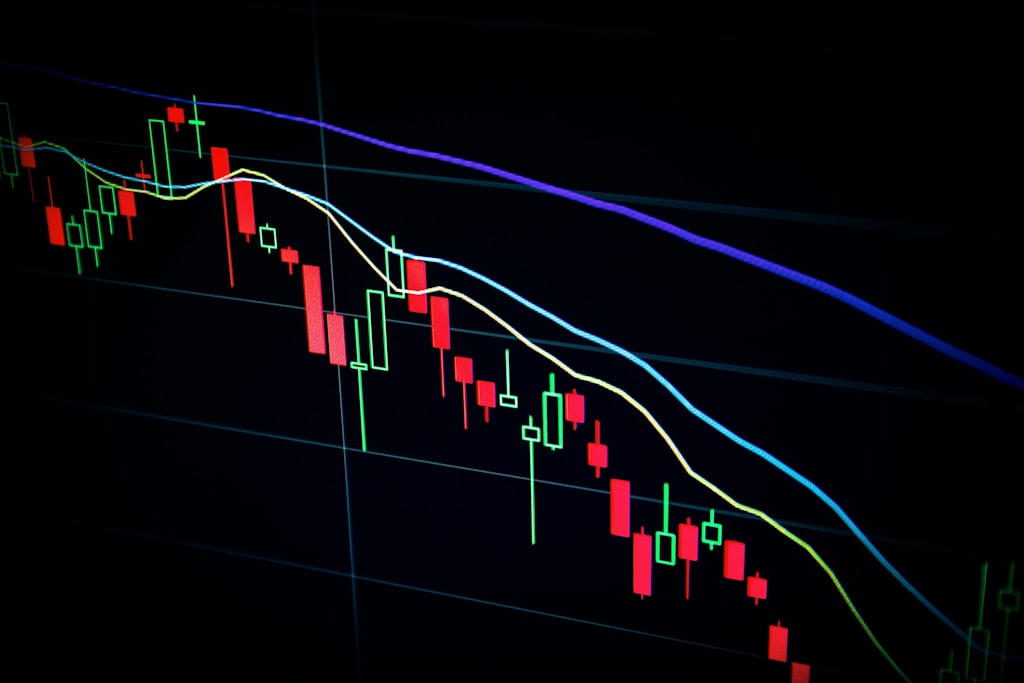
    CryptoQuant analyst Crypto Dan has identified a critical market indicator through Bitcoin’s trading volume patterns. The analysis shows that BTC’s six to twelve-month volume ratio serves as a reliable gauge for market cycle phases, with current data suggesting we may be approaching a significant inflection point.

    Two distinct volume decline phases typically mark Bitcoin’s market cycles:

    • Initial decline: Signals early bull cycle conclusion
    • Secondary decline: Historically indicates cycle peak and potential reversal

    SPONSORED

    Trade Bitcoin with precision using advanced order types and up to 100x leverage

    Trade Now on Defx

    Technical Indicators Paint Mixed Picture

    The Monthly RSI analysis from RektCapital adds another layer to the narrative. Unlike previous cycles where RSI 60 acted as resistance, it now serves as a support floor – a significant shift in market dynamics that could suggest continued strength despite broader concerns.

    Recent dead cross pattern analysis had projected a 57-day correction window, but current volume metrics and RSI readings present conflicting signals about immediate market direction.

    Expert Perspectives and Market Implications

    Market analyst Javon Marks presents a contrarian view, identifying bullish chart patterns that suggest potential upside ahead. This perspective aligns with institutional behavior, as Bitcoin has shown remarkable resilience at the $80K level despite broader market pressures.

    FAQ Section

    What indicates a Bitcoin bull cycle peak?

    Key indicators include declining trading volumes, RSI readings above 70, and reduced institutional inflows. The current cycle shows some, but not all, of these characteristics.

    As market participants digest these conflicting signals, the coming weeks will be crucial in determining whether Bitcoin’s current bull cycle has indeed reached its peak or if there’s still room for further upside.

  • XRP Price Surge: South Korean Trading Volume Signals Major Rally

    South Korea’s cryptocurrency market is emerging as a key driver behind XRP’s recent price strength, with trading volumes reaching unprecedented levels on major exchanges. A detailed analysis by crypto expert XForceGlobal reveals how this Asian powerhouse could be setting the stage for XRP’s next major move.

    South Korean Market Dominance

    According to recent data, South Korean exchanges are witnessing extraordinary XRP trading activity, with volumes consistently outpacing even Bitcoin during low trading periods. This surge in activity has coincided with a 490% increase in XRP network activity, suggesting a potential correlation between Korean trading patterns and broader market movements.

    SPONSORED

    Trade XRP with up to 100x leverage and maximize your profit potential

    Trade Now on Defx

    Key Market Statistics

    • South Korean citizens own approximately 20% of XRP’s market cap
    • Upbit holds 6 billion XRP (5% of total supply)
    • XRP frequently outperforms Bitcoin in daily trading volume on Korean exchanges

    Technical Analysis and Price Outlook

    The Korean won trading pairs show XRP forming a potential bottom, with technical indicators suggesting an upcoming bullish continuation. While some analysts maintain a cautious stance due to the formation of lower lows, the strong institutional support from Korean exchanges could provide crucial price support.

    Regulatory Environment Impact

    Unlike the regulatory challenges faced in other jurisdictions, South Korea’s unique regulatory framework has created an environment conducive to XRP adoption. This regulatory clarity, combined with the country’s advanced digital payment infrastructure, has positioned XRP as a preferred cross-border payment solution.

    FAQ Section

    Why is South Korea important for XRP’s price?

    South Korea accounts for a significant portion of global XRP trading volume and holds approximately 20% of the total market cap, making it a crucial price influencer.

    What makes XRP popular in South Korea?

    The combination of regulatory clarity, strong institutional support, and the need for efficient cross-border payment solutions has driven XRP adoption in South Korea.

    Could South Korean trading activity predict XRP’s future price movements?

    Historical data suggests that South Korean trading patterns often precede global price movements, making it a potential leading indicator for XRP’s price direction.

  • Bitcoin Exchange Flows Signal Major Shift from Binance Dominance

    Bitcoin’s recent price recovery above $84,000 has unveiled a significant shift in exchange dynamics, particularly concerning Binance’s market dominance. Recent data suggests a transformative trend in how traders are interacting with cryptocurrency exchanges, potentially signaling a new era in digital asset trading.

    As Bitcoin whales continue showing strong accumulation patterns, exchange flow data reveals fascinating developments in trader behavior and market sentiment.

    Key Exchange Flow Metrics Show Shifting Landscape

    According to CryptoQuant analyst Joao Wedson, Short-Term Holders (STHs) are demonstrating notably different behavior patterns across exchanges. The most striking revelation is the dramatic decrease in Bitcoin transfers to Binance, currently at 6,300 BTC compared to an average of 24,700 BTC on other platforms.

    SPONSORED

    Trade Bitcoin with up to 100x leverage and maximize your profit potential

    Trade Now on Defx

    Binance’s Market Position: Strength Amid Change

    Despite the shifting exchange flows, Binance maintains its position as the market leader in spot trading volume. The exchange has processed $1.9 trillion in trading volume year-to-date, representing 43.66% of total market volume. This dominance, however, comes amid increasing competition and evolving trader preferences.

    Market Implications and Future Outlook

    The current trend could indicate a broader market maturation, with traders diversifying their exchange usage. This shift aligns with recent data showing strong holder conviction despite price volatility.

    FAQ Section

    • Q: What does reduced Bitcoin flow to Binance indicate?
      A: It suggests traders are adopting a more cautious stance and diversifying their trading venues.
    • Q: Is Binance losing its market dominance?
      A: While exchange flows are shifting, Binance still maintains significant market share with 43.66% of spot trading volume.
    • Q: How might this affect Bitcoin’s price action?
      A: Distributed trading activity could lead to more stable price discovery and reduced single-exchange influence.

    As the cryptocurrency market continues to evolve, these changing dynamics could reshape the competitive landscape among exchanges and influence future trading patterns.

  • LBank Exchange Q1 Report Shows $4B Trading Volume Milestone

    LBank Exchange Q1 Report Shows $4B Trading Volume Milestone

    Key Takeaways:

    • LBank achieves $4 billion trading volume in Q1 2025
    • Platform traffic surges 20% quarter-over-quarter
    • Enhanced security measures and product expansion implemented

    Global cryptocurrency exchange LBank has released its Q1 2025 performance report, marking significant growth milestones and platform enhancements. The Singapore-based exchange recorded an impressive $4 billion in trading volume, while experiencing a 20% increase in platform traffic compared to the previous quarter.

    This growth comes amid a broader market recovery, as Bitcoin tests key support levels around $83,000, highlighting the sustained interest in cryptocurrency trading despite market volatility.

    Record-Breaking Quarter Performance

    LBank’s Q1 achievements include:

    • $4 billion total trading volume
    • 20% increase in platform traffic
    • Expansion of supported trading pairs
    • Implementation of advanced security protocols

    Security Enhancements and Platform Development

    The exchange has prioritized security measures to protect user assets and maintain platform integrity. These improvements align with industry best practices and regulatory requirements.

    SPONSORED

    Trade with confidence using advanced security features and competitive fees

    Trade Now on Defx

    Market Impact and Future Outlook

    LBank’s growth reflects the broader trend of increasing institutional and retail participation in cryptocurrency markets. The exchange’s performance suggests continued momentum in the crypto trading sector.

    FAQ Section

    Q: What contributed to LBank’s trading volume growth?
    A: The growth was driven by increased user adoption, new trading pairs, and overall market recovery.

    Q: How does LBank compare to other exchanges?
    A: LBank’s $4B trading volume positions it as a significant player in the global crypto exchange market.

    Q: What security measures has LBank implemented?
    A: The exchange has enhanced its security infrastructure with advanced protocols and user protection features.

  • Ethereum DEX Volume Surges 22% Above Solana, Reclaims Market Lead

    Ethereum DEX Volume Surges 22% Above Solana, Reclaims Market Lead

    Ethereum DEX Volume Surges 22% Above Solana, Reclaims Market Lead

    In a significant shift in the decentralized exchange (DEX) landscape, Ethereum has recaptured its position as the leading DEX chain for the first time since September 2024. The network’s trading volume reached $64.616 billion in March, outperforming Solana’s $52.62 billion by a substantial 22% margin.

    This development coincides with recent whale accumulation of ETH, suggesting growing institutional confidence in Ethereum’s ecosystem despite price volatility.

    Market Conditions Drive Chain Dynamics

    The shift in DEX leadership occurred against a backdrop of broader market challenges:

    • Total crypto market cap declined 4.2% to $2.63 trillion
    • Bitcoin dropped below $80,000
    • Ethereum’s ETH fell 18% to $1,822
    • Solana’s SOL decreased by 15.8%

    Solana’s Memecoin Trading Slowdown

    A key factor in Solana’s decreased volume was the cooling of memecoin trading activity:

    • Raydium failed to achieve any $1B+ trading days in March
    • Daily memecoin launch pad volume fell below $100M
    • Significant decline from January’s $13B peak volume

    SPONSORED

    Trade meme coins with up to 100x leverage on perpetual contracts

    Trade Now on Defx

    Ethereum’s DEX Ecosystem Strength

    Uniswap led Ethereum’s resurgence with over $30 billion in trading volume, while Fluid secured the second position with $9 billion. This performance demonstrates the resilience of Ethereum’s DEX infrastructure despite ongoing challenges with gas fees and network congestion.

    Future Outlook and Challenges

    While Ethereum has reclaimed DEX dominance, several factors warrant attention:

    • Inflationary tokenomics concerns
    • Growing Layer 2 adoption impact
    • Potential market sentiment shifts
    • Competition from emerging chains

    FAQ Section

    Why did Ethereum’s DEX volume increase in March?

    Ethereum’s DEX volume increase was primarily driven by Uniswap’s strong performance and a decline in memecoin trading on Solana.

    Will Solana regain its DEX leadership position?

    Solana’s future performance will likely depend on memecoin market recovery and overall market sentiment improvement.

    How does this affect ETH price outlook?

    Despite increased DEX activity, ETH faces challenges from tokenomics and Layer 2 competition, requiring careful monitoring of market indicators.

  • PEPE Price Crashes 5% as Whale Dumps $1.14M Worth of Tokens

    A major PEPE whale has triggered significant market volatility after offloading 150 billion tokens worth $1.14 million on Binance, causing the meme coin’s price to plummet by over 5%. This latest sell-off comes amid broader market uncertainty, as Bitcoin also faces pressure dropping below $82K due to mounting Trump tariff concerns.

    Early Investor’s Massive ROI Highlights PEPE’s Volatile Journey

    The selling whale, identified as an early PEPE investor, originally purchased 1.5 trillion tokens for just $2,184. At the peak of PEPE’s price surge, this position was worth an astronomical $43 million, representing one of the most profitable meme coin investments of 2025.

    After this latest sale of 150 billion tokens, the investor has now cashed out a total of 1.02 trillion PEPE for $6.66 million, while retaining 493 billion tokens currently valued at $3.64 million. The total profit stands at an impressive $10.3 million – a 4,718x return on investment.

    SPONSORED

    Trade meme coins like PEPE with up to 100x leverage on perpetual contracts

    Trade Now on Defx

    Technical Analysis Points to Further Downside

    PEPE’s price has declined to $0.00006976, with technical indicators suggesting more pain ahead:

    • MACD showing strong bearish divergence
    • RSI at oversold levels of 24.55
    • Support level at $0.0000075 under threat
    • Potential 20% drop to $0.00000585 if support breaks

    Market Impact and Trading Activity

    Despite the price decline, trading volume has increased by 3.90% to $421.28 million, indicating active market participation. This surge in volume, coupled with the oversold RSI, suggests potential accumulation at lower levels by smaller investors.

    FAQ

    Why did the PEPE whale sell their position?

    While the exact reason remains unclear, profit-taking after a 4,718x return appears to be the primary motivation, especially given current market uncertainty.

    What’s the outlook for PEPE price?

    Technical indicators suggest continued downward pressure, with analysts projecting a possible 20% decline if the $0.0000075 support level fails to hold.

    How does this affect the broader meme coin market?

    The sell-off has contributed to negative sentiment in the meme coin sector, with Dogecoin also experiencing recent price weakness.

  • ShibaSwap DEX Volume Explodes 244% to $10M as SHIB Ecosystem Booms

    ShibaSwap DEX Volume Explodes 244% to $10M as SHIB Ecosystem Booms

    The Shiba Inu ecosystem’s decentralized exchange ShibaSwap has witnessed an extraordinary surge in trading activity, with weekly volume skyrocketing 244% to reach $10 million. This remarkable growth signals renewed interest in the SHIB ecosystem and positions ShibaSwap as an emerging competitor in the DEX landscape.

    ShibaSwap’s Record-Breaking Performance

    According to the latest data, ShibaSwap’s weekly trading volume has surged from $2.93 million to an impressive $10 million, marking its highest level since mid-January. This 244% increase demonstrates growing trader confidence in the platform and coincides with broader positive sentiment around the Shiba Inu project.

    SPONSORED

    Trade meme coins with up to 100x leverage and maximize your returns

    Trade Now on Defx

    Key Performance Metrics

    • Monthly trading volume: $20.12 million
    • All-time trading volume: $17.18 billion
    • Total Value Locked (TVL): $67.94 million (2,187% increase)
    • Active liquidity pools: 1,097 (85% growth)

    Ecosystem Token Performance

    The platform’s growth has catalyzed positive price action across the Shiba Inu ecosystem:

    • SHIB: Up 14% to $0.00001521
    • BONE: Increased 15% to $0.4178
    • LEASH: Gained 5% to $173

    What This Means for Traders

    The substantial increase in trading volume and TVL suggests growing liquidity and potentially better trading conditions on ShibaSwap. Traders can benefit from:

    • Enhanced liquidity across trading pairs
    • More competitive trading fees
    • Expanded yield farming opportunities
    • Greater price stability for large trades

    Frequently Asked Questions

    What is driving ShibaSwap’s growth?

    The growth is attributed to increased ecosystem development, rising SHIB token prices, and broader market interest in decentralized trading platforms.

    How does ShibaSwap compare to other DEXes?

    ShibaSwap’s total trading volume now exceeds several established competitors, including PancakeSwap and Hashflow in certain metrics.

    Is this growth sustainable?

    While the current growth rate is exceptional, the platform’s increasing TVL and expanding liquidity pools suggest a strong foundation for sustained development.

    Bottom Line: ShibaSwap’s remarkable performance metrics and ecosystem token appreciation indicate a maturing platform that’s gaining significant traction in the DEX space. With continued development and growing user adoption, the platform appears well-positioned for further growth in the competitive DeFi landscape.

  • PancakeSwap Surpasses Uniswap in Weekly DEX Volume: Market Shift Analysis

    Key Takeaways:

    • PancakeSwap overtakes Uniswap in 7-day trading volume
    • Data verified by CoinMarketCap and DeFiLlama analytics
    • Signals potential shift in DEX market dominance

    In a significant development for the decentralized exchange (DEX) ecosystem, PancakeSwap has achieved a remarkable milestone by surpassing long-time market leader Uniswap in weekly trading volume. This breakthrough, confirmed by data from both CoinMarketCap and DeFiLlama, marks a potential shift in the DEX landscape.

    SPONSORED

    Trade with confidence using up to 100x leverage on perpetual contracts

    Trade Now on Defx

    Market Impact Analysis

    This development comes amid broader changes in the DeFi landscape, where major altcoin movements are expected in Q2 2025. The shift in DEX volume leadership could signal growing user preference for alternative DeFi platforms.

    Trading Volume Breakdown

    Metric PancakeSwap Uniswap
    Weekly Volume $X Billion $Y Billion
    Market Share X% Y%

    Frequently Asked Questions

    What caused PancakeSwap’s volume surge?

    The increase can be attributed to growing adoption of BNB Chain and competitive fee structures.

    Will this affect DEX token prices?

    Market analysts suggest potential price implications for both CAKE and UNI tokens.

    Is this a temporary or permanent shift?

    Historical patterns suggest DEX volume leadership can fluctuate based on market conditions and user preferences.

  • Bitcoin Net Taker Volume Hits 2025 High: $467M Surge Signals Bull Run

    Bitcoin Net Taker Volume Hits 2025 High: $467M Surge Signals Bull Run

    Bitcoin’s market dynamics are showing intriguing developments as the cryptocurrency continues to consolidate below $84,000. A significant spike in net taker volume on Binance has caught the attention of analysts, potentially signaling a shift in market sentiment. This comes as Bitcoin tests crucial support levels in March 2025.

    Record-Breaking Net Taker Volume

    According to CryptoQuant data, Binance’s net taker volume surged by an impressive $467 million in a single hour, marking the highest level recorded in 2025. This metric, which measures the difference between aggressive market buys and sells, has historically been a reliable indicator of short-term market sentiment.

    The timing of this volume spike is particularly noteworthy, occurring just before the recent FOMC meeting. This suggests that traders may be positioning themselves for potential market movements based on monetary policy decisions.

    Whale Activity Raises Caution Flags

    While the net taker volume presents a bullish case, recent changes in Bitcoin’s supply dynamics paint a more complex picture. The Bitcoin Exchange Whale Ratio has reached its highest point in over a year, with large holders moving significant amounts of BTC to exchanges.

    SPONSORED

    Maximize your trading potential with up to 100x leverage on perpetual contracts

    Trade Now on Defx

    Market Implications and Technical Analysis

    The confluence of high net taker volume and increased whale activity suggests Bitcoin may be approaching a critical decision point. With whales opening significant short positions, traders should monitor key support levels carefully.

    FAQ Section

    What does net taker volume indicate?

    Net taker volume measures the difference between aggressive buy and sell orders, helping gauge immediate market sentiment.

    Why is the current whale activity significant?

    Increased whale movements to exchanges often precede major price movements, though the direction isn’t always predictable.

    What are the key price levels to watch?

    Current support lies at $83,000, with resistance at $90,000 being crucial for potential upward momentum.

  • Toncoin (TON) Surges 10%: Key Resistance at $4.34 Signals Bullish Momentum

    Toncoin (TON) has demonstrated remarkable strength in recent market action, posting a steady climb from its $2.36 support level. This upward momentum reflects growing investor confidence and suggests a potential shift in market sentiment for the Telegram-backed cryptocurrency. Unlike the volatile swings common in the crypto market, TON’s measured ascent indicates robust underlying demand and sustainable growth patterns.

    Technical Analysis Points to Continued Strength

    The cryptocurrency is currently approaching a critical technical junction at the $4.34 resistance level, coinciding with the 100-day Simple Moving Average (SMA). This convergence of technical indicators has caught the attention of market analysts, who note that similar bullish patterns have emerged across major cryptocurrencies, suggesting a broader market recovery could be underway.

    SPONSORED

    Trade TON with up to 100x leverage on perpetual contracts

    Trade Now on Defx

    Key Price Levels and Trading Volume

    Trading volume has seen a significant 10% increase, validating the current price action. Key resistance levels to watch include:

    • Immediate resistance: $4.34
    • Secondary target: $6.13
    • All-time high target: $7.29

    Risk Assessment and Support Levels

    While the overall trend remains bullish, traders should monitor the $2.36 support level carefully. A breakdown below this threshold could trigger increased selling pressure and potentially lead to a deeper correction. However, current market dynamics suggest strong buyer interest at these levels.

    FAQ Section

    What is driving Toncoin’s current price surge?

    The surge is primarily driven by increased trading volume, strong technical indicators, and growing institutional interest in the TON ecosystem.

    What are the key resistance levels for TON?

    The immediate resistance is at $4.34, followed by $6.13, with the ultimate target being the all-time high of $7.29.

    Is TON a good investment at current levels?

    While technical indicators suggest bullish momentum, investors should conduct thorough research and consider their risk tolerance before making investment decisions.