Tag: Trading

  • XRP Price Alert: $2.00 Support at Risk – 20% Drop?

    XRP Price Alert: $2.00 Support at Risk – 20% Drop?

    XRP Market Analysis: Bears Take Control as Price Tumbles

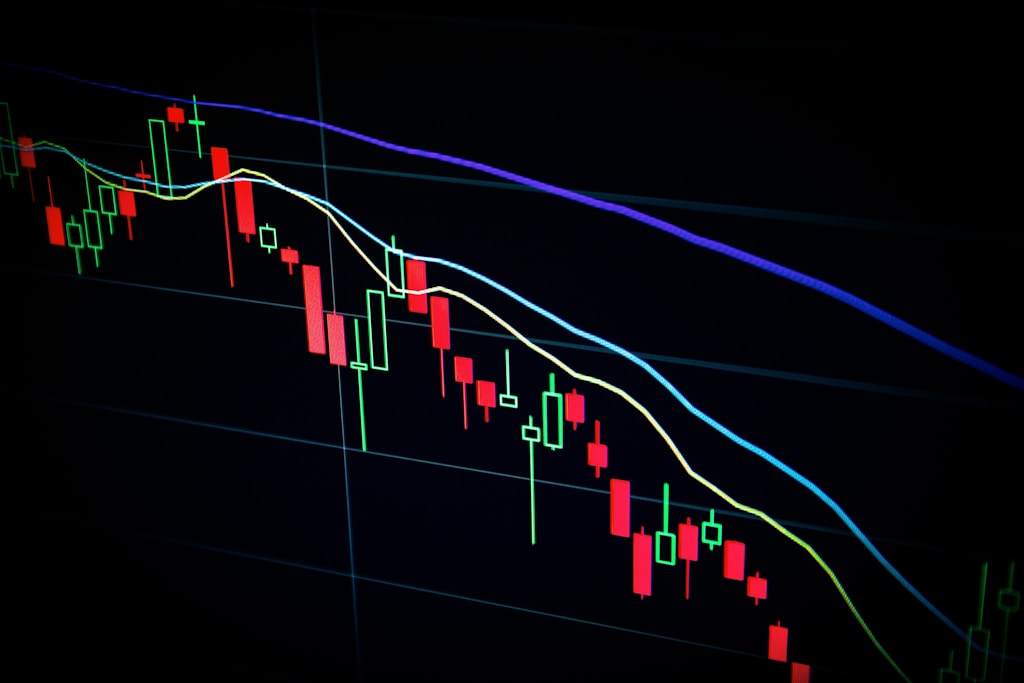
    XRP’s price trajectory has taken a bearish turn, with the cryptocurrency facing significant downward pressure as it breaks below multiple support levels. The digital asset has fallen below the critical $2.35 threshold, signaling potential further losses ahead as market sentiment deteriorates.

    This bearish movement aligns with the broader crypto market downturn, as highlighted in recent market-wide liquidations that sent Bitcoin below $84K.

    Key Technical Developments

    • Price dropped below crucial $2.450 and $2.350 support levels
    • Trading activity now concentrated below the 100-hourly Simple Moving Average
    • Formation of a bearish trend line with resistance at $2.250
    • Critical support level established at $2.00

    Market Implications and Trading Levels

    The technical indicators paint a concerning picture for XRP holders:

    • MACD: Showing increasing bearish momentum
    • RSI: Trading below 50, indicating bearish control
    • Key Support Zones: $2.1480 and $2.120
    • Critical Resistance Levels: $2.250 and $2.3250

    Expert Analysis

    According to cryptocurrency analyst Sarah Chen from Digital Asset Research: “The breakdown below $2.35 suggests a potential shift in market structure. Traders should watch the $2.00 psychological support level carefully, as a breach could trigger cascading liquidations.”

    SPONSORED

    Trade XRP with up to 100x leverage and maximize your profit potential

    Trade Now on Defx

    Looking Ahead

    The immediate outlook for XRP remains bearish unless bulls can reclaim the $2.250 resistance zone. Traders should prepare for potential further downside, with the $2.00 level representing a crucial battleground that could determine the medium-term trend.

    Source: NewsbtC

  • Ethereum Price Crisis: $2,250 Support Crumbles!

    Ethereum Price Crisis: $2,250 Support Crumbles!

    Market Alert: Ethereum Shows Signs of Bearish Momentum

    In a significant market development, Ethereum (ETH) has entered a concerning bearish phase, with the price experiencing a sharp decline from the crucial $2,450 resistance zone. This downturn, mirroring recent broader crypto market weakness, has sent shockwaves through the cryptocurrency community as ETH struggles to maintain key support levels.

    Technical Analysis Reveals Mounting Pressure

    The latest price action shows ETH has declined over 5%, breaking below several critical support levels:

    • Current trading price below $2,450 and the 100-hourly SMA
    • Formation of a bearish trend line with resistance at $2,390
    • Key support level established at $2,250
    • Critical resistance zone between $2,400-$2,500

    Market Implications and Trading Outlook

    Technical indicators paint a concerning picture for Ethereum’s short-term prospects:

    • MACD: Showing increasing bearish momentum
    • RSI: Trading below the 50 zone, indicating bearish sentiment
    • Price Structure: Formation of lower highs and lower lows

    Potential Recovery Scenarios

    While the current outlook appears bearish, several key levels could trigger a recovery:

    • Primary Resistance: $2,450 zone
    • Secondary Resistance: $2,500 level
    • Ultimate Target: $2,620 on successful breakout

    SPONSORED

    Trade Ethereum with up to 100x leverage and maximize your profit potential

    Trade Now on Defx

    Risk Assessment and Support Levels

    Traders should monitor these critical support levels:

    • $2,315: Initial support
    • $2,250: Major support zone
    • $2,120: Secondary support
    • $2,050: Last line of defense

    Expert Analysis

    According to crypto analyst Sarah Chen: ‘The current price action suggests a potential consolidation phase before the next major move. Traders should watch the $2,250 support level carefully as it could determine the medium-term trend.’

    Market strategist Michael Rodriguez adds: ‘The correlation with broader market weakness indicates this might be more than just an ETH-specific issue. The next 48-72 hours will be crucial for determining direction.’

    Looking Ahead

    While the immediate outlook appears challenging, Ethereum’s fundamental strengths remain intact. The upcoming protocol upgrades and growing DeFi ecosystem could provide catalysts for recovery. Traders and investors should maintain strict risk management practices during this period of heightened volatility.

    Source: NewsB

  • Bitcoin Panic: 79K BTC Dump Triggers Market Crisis!

    Bitcoin Panic: 79K BTC Dump Triggers Market Crisis!

    Market Shockwaves as Bitcoin Faces Largest 2025 Sell-Off

    Bitcoin markets were rocked today as panic selling triggered the largest single-day sell-off of 2025, with a staggering 79,300 BTC being sold at a loss within just 24 hours. This massive liquidation event, coinciding with Bitcoin’s critical support level breach at $85K, has sent shockwaves through the crypto ecosystem.

    Key Market Developments:

    • BTC price plummeted below $90,000 support level
    • 79.3K BTC sold at a loss in 24 hours
    • Current trading price: $88,400
    • Key resistance levels: $90K and $95K

    Technical Analysis and Market Outlook

    The dramatic sell-off has pushed Bitcoin to test its 200-day exponential moving average (EMA), a critical technical indicator that often determines long-term market trends. This key support level’s breach could signal a deeper correction ahead.

    SPONSORED

    Trade Bitcoin with up to 100x leverage and maximize your profit potential

    Trade Now on Defx

    Expert Analysis

    CryptoQuant analyst Axel Adler notes, ‘This level of capitulation often marks either a local bottom or the beginning of a broader market correction. The next 48-72 hours will be crucial for determining Bitcoin’s medium-term direction.’

    Critical Support Levels

    For bulls to regain control, Bitcoin needs to:

    • Reclaim $90,000 as immediate support
    • Break above $95,000 to confirm trend reversal
    • Hold the 200-day EMA to prevent further downside

    Market Implications

    This sell-off comes at a crucial juncture, following weeks of price compression and uncertainty. The market now faces a critical test as traders watch for signs of either a bounce or continued bearish momentum.

    Looking Ahead

    The coming days will be decisive for Bitcoin’s price action. A failure to reclaim key levels could trigger another wave of selling, while a strong bounce might signal the end of this correction phase.

    Source: Bitcoinist

  • Bitcoin ETF Exodus Triggers 10% Crash: Bottom Signal?

    Market Shakeout: Record ETF Outflows Rock Bitcoin

    Bitcoin’s price has plunged over 10% in a dramatic two-day selloff, with data showing record outflows from spot Bitcoin ETFs raising concerns about market stability. The leading cryptocurrency is currently trading at $87,818, down sharply from recent highs as investors grapple with mounting macro headwinds.

    According to K33 Research, Bitcoin ETFs recorded their largest single-day outflow since launch, with 14,579 BTC flowing out of ETF products globally. This exodus has dominated February trading, with net outflows occurring on 69% of trading days this month.

    ETF Flows: Warning Sign or Opportunity?

    While the massive outflows have spooked some investors, market analysts are divided on their significance. Trading expert Adam from Trading Riot suggests these dramatic flows typically precede mean reversion, noting that ‘big red numbers’ often trigger panic selling that ultimately sets up the next rally. This perspective aligns with recent analysis of ETF outflow patterns showing similar episodes have historically presented buying opportunities.

    SPONSORED

    Trade Bitcoin with up to 100x leverage on perpetual contracts

    Trade Now on Defx

    Futures Market Dynamics

    The selloff has triggered significant changes in the futures market, with CME futures premium dropping below 5% – approaching risk-free rates. This correction coincides with CME futures volume reaching near-record highs, suggesting institutional traders may be repositioning rather than exiting entirely.

    Macro Factors Amplify Pressure

    Beyond ETF dynamics, broader economic concerns are weighing on crypto markets. Consumer confidence has weakened, with the latest index reading of 98 missing expectations. New trade tensions, including 25% tariffs on Canadian and Mexican imports, have further dampened sentiment.

    Key Events to Watch

    • NVIDIA earnings impact on tech sector sentiment
    • PCE inflation data (forecast 2.5% YoY)
    • Federal Reserve rate cut expectations for June/July

    Market participants should monitor these catalysts closely as they could determine whether the current pullback represents a healthy correction or the start of a deeper retracement.

    Source: Bitcoinist

  • Bitcoin Whales Dump BTC: 96% Dominance Sparks Panic!

    Bitcoin Whales Dump BTC: 96% Dominance Sparks Panic!

    Market Alert: Bitcoin Whales Show Unprecedented Selling Activity

    Bitcoin’s price trajectory has taken a concerning turn as whale activity reaches alarming levels, with large players now controlling 96% of exchange transactions. This dramatic shift in market dynamics comes as BTC struggles below the critical $90,000 mark, sparking fears of an extended bearish phase.

    According to prominent analyst Axel Adler, whale dominance has surged from $94,000 in December 2024 to current levels, marking a significant increase in large-scale selling pressure. This development coincides with growing concerns about a potential bottom at $87,000, as institutional investors appear to be reducing their positions.

    Key Market Indicators

    • Current BTC Price: $89,100
    • Whale Transaction Dominance: 96%
    • Critical Resistance Level: $90,000
    • Next Support Zones: $86,000 and $82,000

    Market Catalysts Behind the Selloff

    Several factors have contributed to the current market situation:

    • Recent ByBit security incident
    • Failed Bitcoin reserve legislation in three U.S. states
    • Negative sentiment in traditional markets due to trade policy concerns
    • Increased regulatory scrutiny of crypto markets

    SPONSORED

    Trade Bitcoin with up to 100x leverage and maximize your profit potential

    Trade Now on Defx

    Technical Analysis and Price Outlook

    For Bitcoin to reverse its current downtrend, bulls must reclaim several key levels:

    • Immediate resistance: $90,000
    • Secondary target: $95,000
    • Major psychological level: $100,000

    Market analysts suggest that failure to hold current support levels could trigger a cascade of selling, potentially pushing prices toward $82,000. However, some experts maintain that this could represent a healthy correction within the broader bull market structure.

    Expert Perspectives

    “While whale selling activity is concerning, it’s important to note that institutional buyers are still present in the market,” states Adler. “The current situation might present a strategic entry point for long-term investors.”

    Looking Ahead

    The next few weeks will be crucial for Bitcoin’s price action. Investors should monitor:

    • Whale transaction patterns
    • Exchange outflow rates
    • Traditional market correlation
    • Institutional buying activity

    Source: Bitcoinist

  • DOGE Holders in Crisis: 59% Crash Sparks Panic!

    Market Analysis

    Dogecoin (DOGE) has plunged into crisis territory, with the leading meme coin experiencing a devastating 59% crash from its December high of $0.48 to a recent low of $0.19. This dramatic decline has sent shockwaves through the crypto market, particularly impacting long-term holders who are showing signs of capitulation.

    On-chain metrics from Glassnode reveal a concerning trend among DOGE’s most dedicated investors. The Long-Term Holder Net Unrealized Profit/Loss (NUPL) indicator has entered what analysts describe as the “denial” phase – a crucial psychological level that often precedes either complete market capitulation or a powerful reversal.

    Technical Outlook

    Currently trading at $0.21, DOGE faces several critical technical levels:

    • Immediate Support: $0.21
    • Key Resistance: $0.24
    • Recent Drop: 19% decline since Monday

    The meme coin sector has been particularly hard hit in the recent market downturn, with analysts warning of a potential further drop to $0.15.

    Market Implications

    The current market structure suggests two potential scenarios:

    1. Bearish Case: Further decline below $0.21 could trigger a cascade of selling
    2. Bullish Case: Reclaiming $0.24 could signal the start of a relief rally

    SPONSORED

    Trade DOGE with up to 100x leverage on perpetual contracts

    Trade Now on Defx

    Long-term Holder Sentiment

    The NUPL indicator’s movement into “denial” territory historically marks a crucial junction. Crypto analyst Ali Martinez suggests this phase could lead to two outcomes:

    • Final capitulation if support levels fail
    • Strong recovery if bulls defend current levels

    Source: NewsBTC

  • SUI Price Alert: $2.80 Support Sparks 50% Rally?

    SUI Price Alert: $2.80 Support Sparks 50% Rally?

    Market Analysis: SUI Shows Signs of Recovery

    The cryptocurrency market is witnessing an intriguing development as Sui (SUI) attempts to stage a comeback, breaking above the crucial $2.80 support level. This price action has caught the attention of traders and analysts alike, potentially signaling a shift in market sentiment for the layer-1 blockchain token.

    Technical Breakdown: Key Levels and Indicators

    The recent price action reveals several critical technical developments:

    • Current support level established at $2.80
    • Resistance encountered at the 50% Fibonacci retracement ($3.079)
    • Trading below the 100-day Simple Moving Average (SMA)
    • Early signs of bullish MACD crossover

    Market Implications and Trading Volume

    While the recent uptick has generated optimism, several factors warrant careful consideration:

    • Volume Analysis: Trading volumes show improvement but remain below peak levels, suggesting cautious participation
    • Key Resistance: The $3.5 level represents a major hurdle for bulls
    • Technical Confluence: Multiple indicators suggest a mixed outlook

    SPONSORED

    Trade SUI with up to 100x leverage on perpetual contracts

    Trade Now on Defx

    Expert Analysis and Price Targets

    Market analysts highlight two critical scenarios:

    Bullish Case:

    • Break above 100-day SMA could trigger rally toward $3.0
    • Volume surge needed to confirm trend reversal
    • MACD crossover suggests potential momentum shift

    Bearish Case:

    • Failure to hold $2.80 could trigger deeper correction
    • Bearish trendline resistance remains intact
    • Volume profile suggests limited buying pressure

    Looking Ahead: Key Developments to Watch

    The next few days will be crucial for SUI’s price action. Traders should monitor:

    • Daily volume trends
    • MACD convergence/divergence patterns
    • Support/resistance reactions at key levels

    As the broader crypto market experiences volatility, SUI’s ability to maintain its recovery above $2.80 will be pivotal for its short-term trajectory. A successful break above key resistance levels could open the path to significant upside potential, while failure to hold support might trigger renewed selling pressure.

    Source: NewsbtC

  • Bitcoin ETF Exodus Alert: $85K Support Crumbles!

    Bitcoin’s price trajectory has taken a concerning turn as the flagship cryptocurrency struggles to maintain support at $85,000, driven by unprecedented outflows from spot Bitcoin ETFs. As of 2:30 p.m. ET, BTC is trading at $84,378, marking a significant downturn that has caught many investors off guard.

    Record ETF Outflows Spark Market Concerns

    This price movement coincides with record outflows from Bitcoin ETFs, suggesting a potential shift in institutional sentiment. The market’s reaction has been swift, with Bitcoin touching three-month lows in recent trading sessions.

    Technical Analysis: Key Support Levels

    Current technical indicators suggest several critical support levels:

    • Primary Support: $84,000
    • Secondary Support: $82,500
    • Critical Level: $80,000

    Market Implications and Expert Perspectives

    According to cryptocurrency analyst Michael van de Poppe, “The current ETF outflows represent a temporary correction rather than a fundamental shift in Bitcoin’s long-term trajectory. Investors should watch the $82,500 level as crucial support.”

    SPONSORED

    Trade Bitcoin with up to 100x leverage and maximize your profit potential

    Trade Now on Defx

    Looking Ahead: Market Catalysts

    Several factors could influence Bitcoin’s price action in the coming days:

    • ETF flow patterns
    • Institutional investor sentiment
    • Macro economic indicators
    • Technical support levels

    Source: Bitcoin.com

  • Bitcoin Crashes Below 84K: $600M Liquidation Panic!

    Bitcoin Crashes Below 84K: $600M Liquidation Panic!

    Market Bloodbath: Bitcoin and Ethereum Hit Multi-Month Lows

    The cryptocurrency market is experiencing a severe downturn as Bitcoin plummets below $84,000, triggering a massive liquidation cascade exceeding $600 million. This dramatic price action has sent shockwaves through the crypto ecosystem, with Ethereum also reaching a five-month low.

    Key Market Developments:

    • Bitcoin Price Action: BTC has fallen below critical support levels, marking its lowest point in recent months
    • Ethereum Performance: ETH hits concerning five-month lows, suggesting broader market weakness
    • Liquidation Impact: Over $600 million in leveraged positions wiped out

    Technical Analysis and Market Implications

    The sudden market downturn has triggered significant technical damage to Bitcoin’s chart structure. Key support levels have been breached, potentially setting up further downside momentum. Market analysts suggest the next critical support zone lies at $80,000, with increased volatility expected in the coming days.

    Expert Perspectives

    According to cryptocurrency analyst Michael van de Poppe: “The current market structure suggests we could see a temporary bottom formation around $80,000 before any significant bounce.”

    Trading veteran Peter Brandt adds: “This correction was overdue given the extended rally we’ve seen. The liquidation cascade indicates overleveraged positions being flushed out.”

    Liquidation Analysis

    The $600 million in liquidations breaks down as follows:

    • Long positions: Approximately 78% of total liquidations
    • Short positions: Remaining 22%
    • Major exchanges affected: Binance, OKX, and Bybit

    Market Outlook

    While the immediate price action appears bearish, historical data suggests such liquidation events often mark temporary bottoms. Traders should remain cautious and monitor key support levels for potential reversal signals.

    SPONSORED

    Trade with up to 100x leverage on perpetual contracts

    Trade Now on Defx

    Source: Decrypt

  • AVAX Price Alert: $20 Support Crumbles – 40% Drop?

    AVAX Price Alert: $20 Support Crumbles – 40% Drop?

    Market Analysis: AVAX Faces Critical Test

    Avalanche (AVAX) has entered dangerous territory as its price hovers precariously near the $20 mark, amid a broader cryptocurrency market downturn that’s triggering widespread concern. This development comes as the crypto market experiences a mass exodus, with investors increasingly moving to sideline positions.

    Technical Breakdown Reveals Bearish Signals

    Since early February, AVAX has demonstrated persistent weakness after failing to breach the crucial $34.40 resistance level. Technical indicators paint a concerning picture:

    • RSI Analysis: The token has entered oversold territory on daily charts
    • Bull Bear Power (BBP): Continues showing negative readings
    • Trendline Analysis: Consistent failure to break above descending trendline

    SPONSORED

    Trade AVAX with up to 100x leverage on perpetual contracts

    Trade Now on Defx

    Market Sentiment Reaches Critical Levels

    The crypto fear and greed index has plummeted to 35, firmly in ‘fear’ territory. This reading historically presents two potential scenarios:

    • Opportunity for contrarian investors
    • Precursor to further market deterioration

    On-Chain Metrics Signal Resistance

    IntoTheBlock’s IOMAP analysis reveals significant overhead resistance at $23.60, where:

    • 128,000+ addresses hold 3.31 million AVAX
    • Potential sell pressure from underwater holders seeking to break even
    • Formation of a substantial ‘sale wall’

    Expert Perspectives

    According to cryptocurrency analyst Sarah Chen: “The current AVAX price action suggests we could see a further 30-40% drawdown before finding strong support. The lack of buying pressure at current levels is particularly concerning.”

    Market Implications

    Investors should watch for these critical levels:

    • Immediate Support: $20.00
    • Secondary Support: $18.50
    • Key Resistance: $23.60

    Looking Ahead

    While the immediate outlook appears bearish, historical data suggests that periods of extreme fear often precede significant market reversals. Traders should maintain strict risk management practices and watch for potential capitulation signals that could mark a bottom.

    Source: NewsbtC