XRP investors are at a critical decision point as the digital asset tests key support levels around $2.37. According to Edward Farina, founder of Alpha Lions Academy and respected XRP analyst, a mere 5% of investors will capitalize on the next major price movement – here’s why this matters for your investment strategy.
This analysis comes at a particularly relevant time, as recent technical indicators suggest a potential 114% rally target from the current $2.37 level.
Market Dynamics: Understanding Recent Price Action
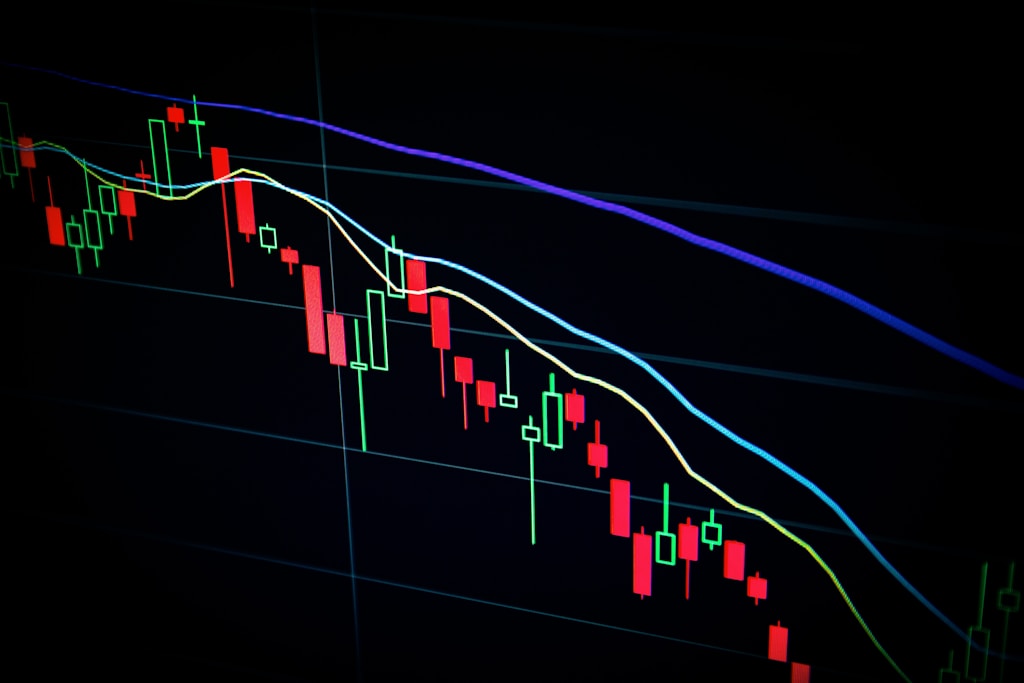
On May 12, XRP experienced a 5.60% decline, dropping from $2.47 to $2.33 within 24 hours. While such movements typically trigger panic selling, Farina emphasizes that these dips often precede significant rallies.
Historical Perspective: Lessons from Previous Cycles
Historical data shows that investors who sold during previous corrections at $0.50-$0.70 missed out on triple-digit gains. This pattern aligns with Ripple’s expanding global presence and strategic partnerships, which continue to strengthen XRP’s fundamental value proposition.
The Three-Step Strategy for Success
- Accumulate during market uncertainty
- Maintain long-term holding positions
- Develop conviction through market research
Institutional Backing and Market Position
XRP’s role as a bridge currency has attracted attention from major financial institutions, including the IMF and Bank for International Settlements. This institutional interest provides a strong foundation for long-term value appreciation.
Risk Management Considerations
While Farina advocates for strong conviction, proper risk management remains crucial. Investors should:
- Set clear stop-loss levels
- Diversify holdings appropriately
- Only invest what they can afford to lose
Current Market Status and Outlook
At press time, XRP trades at $2.37, showing a 3.25% decline over 24 hours and a 1.7% weekly drop. Technical indicators suggest potential for significant upward movement, but timing remains crucial.
FAQ Section
Q: What makes this XRP rally different from previous ones?
A: Institutional adoption and regulatory clarity provide stronger fundamentals than previous cycles.
Q: How long should investors hold XRP?
A: Farina suggests a minimum holding period of one complete market cycle, typically 2-3 years.
Q: What are the key price levels to watch?
A: Current support at $2.35 and resistance at $2.47 are crucial for short-term movement.