Tag: Xrp Price

  • XRP Price Forms Critical Bottom at $2.02: Analysts Eye $3.80 Target

    XRP Price Forms Critical Bottom at $2.02: Analysts Eye $3.80 Target

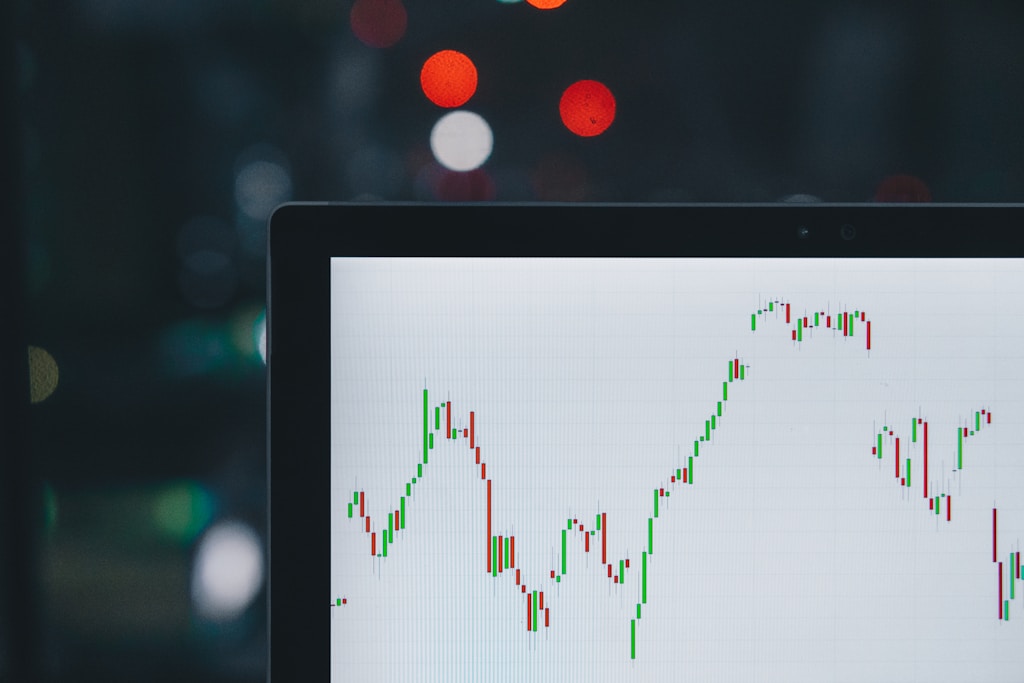
    XRP’s price action is showing signs of a potential local bottom after touching $2.0238 on Monday, with a subsequent 6% recovery sparking optimism among analysts. Two prominent technical analysts have provided detailed insights into XRP’s current market position and potential trajectory.

    Technical Analysis Points to Bullish Divergence

    According to respected crypto analyst CasiTrades, XRP has tested a crucial technical level at the 0.786 Fibonacci retracement ($2.05). More importantly, bullish divergences are appearing across multiple timeframes, from 15-minute to 4-hour charts, suggesting strong potential for both immediate and longer-term recovery.

    The analysis gains additional credibility when viewed alongside recent historical pattern analysis suggesting a potential 718% rally target, though immediate resistance levels must be cleared first.

    SPONSORED

    Trade XRP with up to 100x leverage on perpetual contracts

    Trade Now on Defx

    Key Price Levels to Watch

    Critical resistance stands at $2.25, with CasiTrades suggesting that a decisive break above this level could eliminate the need for further support retests. Support levels are currently established at:

    • Primary support: $2.00-2.01
    • Weekly Ichimoku base line: $1.94
    • Weekly Supertrend: $1.73
    • Weekly EMA Ribbon: $1.46-1.93

    Head and Shoulders Pattern: Valid Concern or False Signal?

    While some traders have identified a potential head and shoulders pattern targeting $1.15, Charting Guy dismisses this formation as “irregular and ugly,” suggesting it’s unlikely to play out. The overall trend remains bullish, characterized by higher highs and higher lows.

    XRP Price Forecast

    Looking ahead, analysts have identified several potential targets:

    • Immediate resistance: $2.25
    • Mid-term target: $2.70
    • Extended target: $3.80+

    FAQ

    What is the current XRP price?

    At press time, XRP is trading at $2.14.

    What are the key support levels for XRP?

    Key support levels include $2.00-2.01, $1.94 (Weekly Ichimoku), and $1.73 (Weekly Supertrend).

    What is the next major resistance level?

    The immediate significant resistance level is at $2.25.

  • XRP Price Target $27: Historical Pattern Signals 718% Rally Potential

    XRP Price Target $27: Historical Pattern Signals 718% Rally Potential

    XRP could be on the verge of a massive price surge, with crypto analyst Egrag Crypto predicting a potential rise to $27 within 60 days based on historical pattern analysis. As XRP currently tests the crucial $2.15 resistance level, this bold prediction has sparked intense debate in the crypto community.

    Historical Pattern Analysis Points to Major XRP Rally

    The analysis draws striking parallels between current market conditions and the 2017-2018 bull run, suggesting a potential 718% price increase from current levels. This technical forecast comes at a critical time when XRP is showing signs of increased market volatility.

    SPONSORED

    Trade XRP with up to 100x leverage on perpetual contracts

    Trade Now on Defx

    Key Price Levels to Watch

    For this ambitious target to materialize, XRP needs to clear several critical resistance levels:

    • Initial resistance: $2.62
    • Secondary threshold: $3.00
    • Critical breakout level: $3.40
    • Profit-taking zone: $9.70
    • Ultimate target: $27.00

    Market Catalysts and Growth Drivers

    Several factors could potentially fuel this predicted price surge:

    • Increased institutional adoption
    • Positive regulatory developments
    • Overall crypto market momentum
    • Technical pattern confirmation
    • Growing retail interest

    Current Market Performance

    XRP is currently trading at $2.15, showing mixed short-term performance:

    • 24-hour gain: +4%
    • Weekly performance: -12%
    • Trading volume: Significantly increased

    Expert Analysis and Market Sentiment

    While the prediction may seem ambitious, it’s backed by technical analysis and historical data. However, investors should note that past performance doesn’t guarantee future results.

    Frequently Asked Questions

    Can XRP really reach $27?

    While possible based on historical patterns, such a move would require significant market catalysts and sustained buying pressure.

    What are the main risks to this prediction?

    Market volatility, regulatory changes, and overall crypto market conditions could impact the predicted price trajectory.

    How long might this rally take?

    The analysis suggests a 60-day timeframe, but market conditions could extend or compress this period.

    Disclaimer: This article is for informational purposes only and should not be considered financial advice. Always conduct your own research before making investment decisions.

  • XRP Price Tests $2.15 Resistance: Bulls Fight for April Recovery

    XRP price is showing signs of recovery after a sharp decline, with bulls attempting to reclaim key resistance levels near $2.15. The cryptocurrency market’s recent volatility has put XRP traders on high alert as technical indicators suggest a potential major move ahead.

    As noted in our recent XRP price analysis, the $2.00 level remains a critical support zone that bulls must defend to prevent further downside.

    Key Technical Developments for XRP

    • Price declined below $2.080 after failing to breach $2.20 resistance
    • Currently trading under the 100-hour Simple Moving Average
    • Bearish trend line forming with resistance at $2.10
    • Critical support established at $2.020

    SPONSORED

    Trade XRP with up to 100x leverage on perpetual contracts

    Trade Now on Defx

    Technical Analysis Deep Dive

    The recent price action shows XRP attempting to recover after forming a local bottom at $2.023. The cryptocurrency has cleared the 23.6% Fibonacci retracement level but faces significant overhead resistance. Here’s what traders need to watch:

    Resistance Levels

    • Primary resistance: $2.150
    • Secondary resistance: $2.1680
    • Major hurdle: $2.2880

    Support Structure

    • Immediate support: $2.050
    • Critical support: $2.020
    • Major support: $1.880

    Market Indicators and Signals

    Technical indicators are providing mixed signals for XRP’s short-term trajectory:

    • MACD: Showing bearish momentum but pace is slowing
    • RSI: Currently above 50, indicating neutral to slightly bullish sentiment
    • Moving Averages: Price trading below 100-hour SMA suggests bearish pressure

    Potential Scenarios and Trading Implications

    Two primary scenarios are emerging for XRP traders:

    Bullish Scenario

    A break above $2.1680 could trigger a rally toward $2.20 and potentially $2.250. Bulls need to maintain momentum above the current resistance levels to validate this scenario.

    Bearish Scenario

    Failure to clear $2.120 resistance could lead to renewed selling pressure. A break below $2.020 might trigger a decline toward $2.00 or even $1.880 support levels.

    Frequently Asked Questions

    What’s causing the current XRP price volatility?

    The volatility is primarily driven by broader market conditions and technical factors, including resistance at key price levels and shifting trader sentiment.

    What are the key levels to watch for XRP traders?

    Traders should monitor the $2.150 resistance and $2.020 support levels as these represent critical price points for potential trend reversals.

    Could XRP break above $2.20 in the near term?

    While possible, XRP needs to clear several resistance levels and show increased buying pressure to achieve this target.

  • XRP Price Struggles at $2: Key Support Levels Signal Potential Reversal

    XRP Price Struggles at $2: Key Support Levels Signal Potential Reversal

    Key Takeaways:

    • XRP currently trading between $2.11-$2.13
    • Market cap stands at $123 billion
    • 24-hour trading volume reaches $3.39 billion
    • Price range: $2.06-$2.22

    XRP’s price action has entered a critical phase as the digital asset struggles to maintain its position near the $2 mark. As recent analysis suggested a $3 breakout target would be needed to invalidate the bearish pattern, traders are closely monitoring key support levels for potential reversal signals.

    Current Market Conditions

    The cryptocurrency is experiencing significant pressure from sellers, with price action confined to a narrow range between $2.11 and $2.13. With a substantial market capitalization of $123 billion, XRP remains one of the top cryptocurrencies by value, though recent price action suggests mounting bearish pressure.

    Technical Analysis

    The hourly chart reveals several critical support and resistance levels:

    • Immediate Support: $2.06
    • Key Resistance: $2.22
    • Volume Profile: $3.39 billion in 24-hour trading volume indicates active market participation

    Trading Volume Analysis

    The current trading volume of $3.39 billion suggests significant market interest, though the price compression indicates potential accumulation at these levels. Traders should watch for volume spikes as potential indicators of trend direction.

    SPONSORED

    Trade XRP with up to 100x leverage on perpetual contracts

    Trade Now on Defx

    FAQ

    Q: What’s causing XRP’s current price struggle?
    A: Technical indicators suggest a combination of profit-taking and broader market uncertainty are contributing to the current price action.

    Q: What are the key levels to watch?
    A: Traders should monitor the $2.06 support and $2.22 resistance levels for potential breakout signals.

    Q: Could XRP reverse its current trend?
    A: While bearish pressure remains dominant, increased buying volume above $2.22 could signal a potential trend reversal.

  • XRP Price Alert: $3 Breakout Needed to Invalidate Bearish Pattern

    XRP Price Alert: $3 Breakout Needed to Invalidate Bearish Pattern

    XRP faces a critical technical juncture as the cryptocurrency struggles to maintain momentum above $2.20. According to prominent crypto analyst Ali Martinez, a decisive break above $3 is necessary to invalidate a bearish head-and-shoulders pattern and trigger a potential bullish reversal.

    The digital asset has shown mixed signals after failing to breach the $2.60 resistance level, with price action now gravitating toward critical demand zones. This technical uncertainty comes amid broader market volatility, as highlighted in recent analysis showing a 90% chance of major price movements in the crypto market.

    Technical Analysis Points to Critical Support Levels

    XRP currently trades at $2.22, having lost the crucial $2.40 support level that coincided with both the 4-hour 200 MA and EMA. The breakdown has placed bulls in a defensive position, with $2.20 emerging as a vital support zone that must hold to prevent further deterioration.

    SPONSORED

    Trade XRP with up to 100x leverage on perpetual contracts

    Trade Now on Defx

    Key Price Levels to Watch

    • Immediate Resistance: $2.35
    • Major Resistance: $2.60
    • Critical Breakout Level: $3.00
    • Current Support: $2.20
    • Secondary Support: $2.00

    Market Implications and Future Outlook

    The formation of a head-and-shoulders pattern has raised concerns among traders, particularly as it coincides with increasing selling pressure in the broader crypto market. This technical setup typically signals a potential trend reversal, making the $3 level particularly significant for XRP’s near-term trajectory.

    Frequently Asked Questions

    What happens if XRP breaks above $3?

    A break above $3 would invalidate the bearish head-and-shoulders pattern and potentially trigger a significant bullish rally.

    What’s the worst-case scenario for XRP?

    If support at $2.20 fails, XRP could see a decline toward the psychological $2.00 level, which has historically acted as strong support.

    How does the current market volatility affect XRP?

    The broader market uncertainty has contributed to XRP’s sideways trading pattern, making it crucial for the token to maintain key support levels.

  • XRP Price Drops Below $2.40: Technical Analysis Points to $2.20 Target

    XRP Price Drops Below $2.40: Technical Analysis Points to $2.20 Target

    XRP’s price trajectory has taken a bearish turn, with the cryptocurrency showing significant weakness after failing to breach the critical $2.420 resistance level. This technical analysis explores the key levels to watch and potential scenarios for XRP’s price movement in the coming days.

    Current Market Overview

    The digital asset is experiencing mounting selling pressure, with several technical indicators pointing to continued bearish momentum. As noted in our recent coverage of XRP’s surging open interest, market dynamics have shifted significantly in the past 24 hours.

    Key Technical Levels

    • Current Price: Trading below $2.40
    • Critical Resistance: $2.420
    • Immediate Support: $2.30
    • Secondary Support: $2.20
    • 100-hourly SMA: Below price action

    Bearish Pattern Formation

    A concerning bearish trend line has emerged on the hourly chart, with resistance firmly established at $2.35. The price action is showing weakness below the 23.6% Fibonacci retracement level, calculated from the recent swing high of $2.478 to the low of $2.301.

    SPONSORED

    Trade XRP with up to 100x leverage on perpetual contracts

    Trade Now on Defx

    Resistance Levels Analysis

    Multiple resistance levels stand in the way of potential recovery:

    • $2.3850: 50% Fibonacci retracement level
    • $2.420: Major psychological resistance
    • $2.450: Previous support turned resistance

    Support Zones to Watch

    If selling pressure continues, these support levels become crucial:

    • $2.30: Immediate support zone
    • $2.20: Critical support level
    • $2.120: Secondary support
    • $2.050: Major support zone

    Technical Indicators

    Indicator Signal
    MACD Bearish momentum increasing
    RSI Below 50, indicating bearish control
    Moving Averages Below 100-hour SMA

    Potential Scenarios

    Two primary scenarios emerge from current market conditions:

    Bearish Scenario

    A break below $2.30 could trigger cascading sells, potentially pushing XRP toward $2.20 or lower. Volume analysis suggests significant support at $2.20, making it a crucial level for bulls to defend.

    Bullish Scenario

    Recovery above $2.40 could signal trend reversal, but multiple resistance levels must be cleared for sustained upward momentum. The $2.420-$2.450 zone remains critical for any bullish continuation.

    FAQ

    What’s causing XRP’s current price decline?

    Technical factors including failed resistance tests and bearish momentum indicators are primary contributors to the current downward pressure.

    Where is the strongest support level for XRP?

    The $2.20 level represents the strongest support zone, backed by historical trading volume and technical indicators.

    What needs to happen for XRP to reverse its downtrend?

    A decisive break above $2.420 with increased volume would be the first signal of potential trend reversal.

    Conclusion: XRP faces significant technical challenges in the short term, with multiple indicators suggesting continued bearish pressure. Traders should watch the $2.30 support level closely while monitoring volume patterns for potential trend reversal signals.

  • XRP Open Interest Surges 36% to $2.89B: Bulls Eye $2.60 Breakout

    XRP’s derivatives market is showing significant bullish momentum as open interest surges 36% in just two weeks, reaching $2.89 billion. This dramatic increase in futures contract allocation comes as XRP tests critical resistance levels amid broader market uncertainty.

    Key Open Interest Metrics Signal Growing Momentum

    According to Glassnode data, XRP futures open interest has jumped from $2.12 billion to $2.89 billion since March 11, coinciding with a 35% price surge. This significant increase in derivatives exposure suggests institutional traders and large investors are positioning for potential upside moves.

    SPONSORED

    Trade XRP with up to 100x leverage on perpetual contracts

    Trade Now on Defx

    Technical Analysis: Key Price Levels to Watch

    XRP currently trades at $2.35, facing immediate resistance at $2.60. A successful break above this level could trigger a rally toward the range high at $3.40. However, bulls must defend crucial support at $2.25 to maintain momentum.

    Market Context and Risk Factors

    The surge in open interest comes amid heightened macro uncertainty, with growing trade war concerns and policy signals from the Trump administration affecting crypto markets. While institutional interest is rising, traders should monitor key support levels for potential pullback scenarios.

    FAQ

    • What does rising open interest indicate?
      Increasing open interest typically signals growing market participation and can suggest trend continuation.
    • What are the key resistance levels for XRP?
      Primary resistance sits at $2.60, with major resistance at $3.40.
    • What could trigger a bearish reversal?
      A break below $2.25 support could lead to a retest of $2.00.
  • XRP Price Faces Critical $2.42 Resistance After 7% Drop – Bears Take Control?

    XRP Price Faces Critical $2.42 Resistance After 7% Drop – Bears Take Control?

    XRP’s price action has taken a bearish turn, dropping 7% from the key $2.50 resistance level as technical indicators point to potential further downside. This analysis explores the critical support and resistance levels that traders should watch, along with expert insights on XRP’s next likely moves.

    This price movement comes amid broader market uncertainty, with veteran trader Peter Brandt recently warning of a potential 44% drop to $1.07 for XRP. The current technical setup appears to validate some of these concerns.

    Key Technical Levels Show Bearish Pressure

    The latest price action reveals several critical technical developments:

    • Break below the bullish trend line at $2.440
    • Price trading under the 100-hourly Simple Moving Average
    • RSI dropping below the crucial 50 level
    • MACD showing increasing bearish momentum

    SPONSORED

    Trade XRP with up to 100x leverage and maximize your profit potential

    Trade Now on Defx

    Critical Support and Resistance Levels

    Traders should monitor these key price levels:

    Type Level Significance
    Major Resistance $2.450 Previous support turned resistance
    Immediate Resistance $2.420 Current price ceiling
    Key Support $2.350 Critical holding level
    Major Support $2.320 Break below could trigger further selling

    Potential Scenarios and Trading Implications

    Two primary scenarios are emerging:

    Bullish Case

    • Break above $2.450 could target $2.50
    • Further momentum could push price to $2.620
    • Ultimate target at $2.80 if bulls maintain control

    Bearish Case

    • Failure to clear $2.420 resistance likely triggers more selling
    • Break below $2.320 opens path to $2.20
    • Worst case scenario targets $2.150 support zone

    Technical Indicator Analysis

    Current technical readings suggest increasing bearish pressure:

    • MACD: Losing momentum in bearish territory
    • RSI: Below 50, indicating bearish control
    • Moving Averages: Price below 100-hour SMA

    FAQ

    What’s causing XRP’s current price decline?

    The decline appears technical in nature, triggered by failure to break the $2.50 resistance and broader market uncertainty.

    Where is the safest support level for XRP?

    The $2.320 level represents the strongest support, with multiple technical indicators confirming its significance.

    What could trigger an XRP recovery?

    A clear break above $2.450 with strong volume could signal a trend reversal and potential recovery.

    Traders should maintain strict risk management given the current market conditions and watch for potential trend confirmation before taking significant positions.

  • XRP Price Tests $2.50 Resistance: Key Levels for Bullish Breakout

    XRP Price Tests $2.50 Resistance: Key Levels for Bullish Breakout

    XRP price is showing signs of recovery, testing critical resistance at $2.50 as bulls attempt to regain momentum. As highlighted in our previous XRP analysis, the cryptocurrency continues to face significant overhead resistance that could determine its next major move.

    XRP Price Analysis: Key Technical Levels

    The digital asset has established a series of higher lows, with current price action showing:

    • Strong support at $2.420 with the 100-hourly SMA acting as a buffer
    • Formation of a bullish trend line at $2.430
    • Critical resistance cluster between $2.480-$2.50
    • 50% Fibonacci retracement level providing intermediate support

    Bullish Scenario and Targets

    If bulls successfully breach the $2.50 resistance, XRP could target several key levels:

    • Initial target: $2.550
    • Secondary resistance: $2.650
    • Major psychological level: $2.80

    SPONSORED

    Trade XRP with up to 100x leverage on perpetual contracts

    Trade Now on Defx

    Bearish Risk Factors

    Traders should monitor these potential downside scenarios:

    • Break below $2.420 could trigger further selling
    • Critical support at $2.40 must hold to prevent deeper correction
    • Potential downside target at $2.350 if support fails

    Technical Indicators Overview

    Indicator Signal
    MACD Losing bullish momentum
    RSI Neutral at 50 level
    Moving Averages Trading above 100-hour SMA

    Frequently Asked Questions

    What is the key resistance level for XRP right now?

    The critical resistance level is at $2.50, with additional resistance at $2.480.

    Where is the strongest support level for XRP?

    The strongest support lies at $2.420, reinforced by the 100-hour Simple Moving Average.

    What could trigger an XRP breakout?

    A clear break above $2.50 with strong volume could trigger a rally toward $2.650 and potentially $2.80.

    Conclusion: While XRP shows promising recovery signs, the $2.50 resistance remains crucial for determining the next significant move. Traders should closely monitor volume and technical indicators for confirmation of any breakout or breakdown scenarios.

  • Ripple Wins $75M SEC Fine Refund as Legal Battle Nears End

    Ripple Wins $75M SEC Fine Refund as Legal Battle Nears End

    Ripple Wins $75M SEC Fine Refund as Legal Battle Nears End

    In a major victory for the cryptocurrency industry, Ripple Labs is set to receive a $75 million refund from its court-ordered fine, marking a significant turning point in its lengthy legal battle with the U.S. Securities and Exchange Commission (SEC). This development comes as XRP continues testing key price levels around $2.40, with market sentiment showing signs of improvement.

    Key Developments in the Ripple-SEC Settlement

    • SEC to return $75 million of the original $125 million fine
    • Ripple agrees to drop cross-appeal against SEC
    • Standard injunction against Ripple to be lifted
    • Settlement subject to commissioner and court approval

    Understanding the Settlement Impact

    The proposed settlement represents a significant shift in the regulatory landscape for cryptocurrency companies. Stuart Alderoty, Ripple’s chief legal officer, confirmed via X (formerly Twitter) that the SEC will retain only $50 million of the original fine, with the remaining $75 million returning to Ripple’s coffers.

    SPONSORED

    Trade XRP with up to 100x leverage on perpetual contracts

    Trade Now on Defx

    Market Response and XRP Performance

    Following the announcement, XRP experienced a modest 1.5% price increase, though gains were partially retraced as the token settled around $2.47. This price action aligns with broader market movements, as both Bitcoin and the CoinDesk 20 Index showed similar patterns.

    Historical Context and Future Implications

    The settlement follows Judge Analisa Torres’ 2023 ruling that distinguished between Ripple’s institutional and programmatic sales of XRP. This precedent-setting decision could influence future cryptocurrency regulatory cases and SEC enforcement actions.

    FAQ Section

    What does this mean for XRP holders?

    The settlement provides regulatory clarity and could potentially boost market confidence in XRP trading and adoption.

    Will this affect other crypto companies facing SEC scrutiny?

    The case sets an important precedent for how cryptocurrency sales may be classified under securities laws.

    What’s next for Ripple?

    With the legal cloud lifting, Ripple can focus on business expansion and development of its payment network technology.

    Looking Ahead

    As the crypto industry awaits final approval of the settlement, this resolution could mark a turning point in how digital assets are regulated in the United States. The outcome may provide a framework for other companies facing similar regulatory challenges.