XRP ETFs Launch on Nasdaq: XRPI and XRPT Offer 2x Exposure
In a groundbreaking development for the XRP ecosystem, Volatility Shares has launched two pioneering exchange-traded funds (ETFs) on the Nasdaq...
In a groundbreaking development for the XRP ecosystem, Volatility Shares has launched two pioneering exchange-traded funds (ETFs) on the Nasdaq...

Key Takeaways:XRP currently trading at $2.43 with $142B market cap24-hour trading volume reaches $3.754BTechnical patterns suggest potential breakout aheadXRP's price...
In a stunning development for XRP investors, crypto analyst Real Remi Relief has unveiled a bold prediction suggesting XRP could...
A prominent crypto analyst known as Doctor Profit has made waves in the crypto community by announcing a major portfolio...

In a surprising turn of events during Q1 2025, XRP has emerged as a standout performer in the cryptocurrency market,...
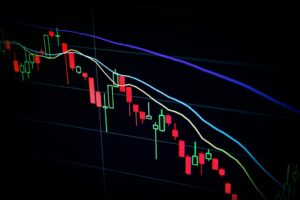
XRP's price action is showing promising signs of an imminent breakout as the cryptocurrency consolidates above crucial support levels. Recent...
XRP's price action is showing promising signs of a potential bullish reversal, with a key technical pattern suggesting significant upside...

The cryptocurrency market faces another regulatory hurdle as the Securities and Exchange Commission (SEC) announces extended review periods for multiple...
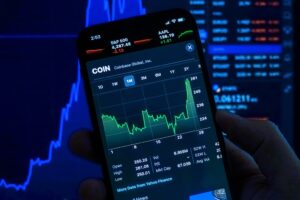
In a groundbreaking development for the XRP ecosystem, the cryptocurrency has achieved a significant institutional milestone with the launch of...
In a significant development for the XRP ecosystem, as XRP consolidates near $2.30 with potential for further upside, XRPTurbo has...


