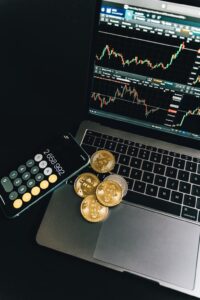
Tag: Xrp

  • XRP Dominates Retail Trading as Daily Active Addresses Surge 490%

    Glassnode’s latest on-chain analysis reveals a significant shift in retail investor behavior, with XRP emerging as the dominant choice for retail traders in the current market cycle. The report, titled ‘Rippling Away,’ shows XRP’s remarkable growth in user activity despite Bitcoin’s consolidation between $76,000-$87,000.

    In a striking comparison, XRP’s daily active addresses have surged by 490% from the 2022 cycle low, while Bitcoin saw just a 10% increase. This dramatic divergence highlights unprecedented retail interest in XRP, with its Realized Cap nearly doubling from $30.1 billion to $64.2 billion between December 2024 and early 2025.

    SPONSORED

    Trade XRP with up to 100x leverage on perpetual contracts

    Trade Now on Defx

    However, this retail enthusiasm comes with warning signs. As noted in recent analysis of XRP market dynamics, the current structure shows increasing fragility. Glassnode’s data indicates a concerning trend in the Realized Loss/Profit Ratio, which has steadily declined since January 2025.

    Key Market Indicators

    • Daily Active Addresses: +490% increase from 2022 cycle low
    • Realized Cap Growth: $30.1B to $64.2B (Dec 2024 – Early 2025)
    • New Capital Inflow: Approximately $30B in last 6 months
    • Current Trading Price: $2.00

    Risk Factors and Market Outlook

    The report highlights several concerning factors that could impact XRP’s price stability:

    • Top-heavy cost basis structure
    • Declining profitability metrics
    • Waning retail confidence since February 2025
    • High concentration of new investors vulnerable to volatility

    Frequently Asked Questions

    What’s driving XRP’s retail popularity?

    The surge in retail interest can be attributed to XRP’s strong performance and increased accessibility through major exchanges.

    Is the current XRP rally sustainable?

    Glassnode’s data suggests caution, with multiple indicators pointing to potential market saturation and declining momentum.

    How does XRP’s performance compare to Bitcoin?

    While XRP shows stronger retail participation metrics, Bitcoin maintains more stable long-term holder behavior and institutional interest.

    At press time, XRP trades at $2.00, with market participants closely monitoring these evolving trends for signs of directional change.

  • XRP Whales Move $16M as Price Target Hits $15 Amid Market Surge

    XRP Whales Move $16M as Price Target Hits $15 Amid Market Surge

    A significant crypto market announcement has triggered massive whale movements in XRP, with over $16 million worth of tokens changing hands in just 24 hours. This surge in activity comes as analysts project major price movements in the XRP/ETH trading pair, setting up a potential battle for dominance in the altcoin space.

    XRP Price Analysis: Breaking Down the $15 Target

    Currently trading at $2.11, XRP has shown remarkable resilience, climbing from $1.88 over the past two weeks. The recent SEC settlement, which reduced penalties from $125 million to $50 million, has removed a significant regulatory overhang. Technical analysis suggests a clear path to $15 if the critical $2.50 resistance level breaks – a price point tested three times in the last six months.

    Whale Activity Signals Strong Institutional Interest

    On-chain data reveals whale wallets moving 8 million XRP tokens within 24 hours, suggesting strong institutional positioning. This activity coincides with Ripple’s growing ecosystem developments, particularly in the stablecoin sector where RLUSD recently achieved significant milestones.

    SPONSORED

    Trade XRP with up to 100x leverage and maximize your profit potential

    Trade Now on Defx

    Market Implications and Future Outlook

    Trading volume has surged to $2 billion daily, though the 100 billion total supply and monthly escrow releases of 1 billion XRP could impact price momentum. Analysts point to several catalysts that could drive XRP toward the $15 target:

    • Potential ETF approval speculation
    • Growing institutional adoption
    • Expanding cross-border payment partnerships
    • Regulatory clarity advantages over competitors

    FAQ Section

    What’s driving the current XRP whale activity?

    Recent regulatory clarity and potential ETF developments have encouraged large holders to accumulate positions.

    Can XRP realistically reach $15?

    While ambitious, analysts cite institutional adoption and technical indicators supporting this target, though significant market conditions must align.

    How does the SEC settlement impact XRP’s future?

    The reduced fine and regulatory clarity position XRP favorably for institutional adoption and exchange listings.

  • XRP Price Holds $2.05: Key Technical Signals Point to Reversal

    XRP Price Holds $2.05: Key Technical Signals Point to Reversal

    Key Takeaways:

    • XRP currently trading at $2.05 with $119B market cap
    • 24-hour trading volume reaches $6.51B with range of $1.97-$2.19
    • Price sitting 40.2% below all-time high with potential reversal signals emerging

    XRP’s price action has captured market attention as the digital asset maintains support at $2.05, a critical level that could determine its short-term trajectory. This price point coincides with recent developments in the broader Ripple ecosystem, including the successful growth of RLUSD integration which recently hit $250M in market cap.

    Market Position and Technical Analysis

    The cryptocurrency is currently showing resilience at the $2.05 support level, with a substantial market capitalization of $119 billion. This valuation marks the lowest point since March 10, 2025, and December 30, 2024, suggesting a potential bottom formation.

    Trading activity remains robust with a 24-hour volume of $6.51 billion, indicating strong market participation. The intraday trading range of $1.97 to $2.19 demonstrates significant volatility, with bulls defending the lower support levels.

    Technical Indicators and Momentum

    Price action on the 1-hour chart reveals several key technical developments:

    • RSI showing potential bullish divergence
    • MACD histogram beginning to flatten
    • Volume profile supporting current support level

    SPONSORED

    Trade XRP with up to 100x leverage and maximize your profit potential

    Trade Now on Defx

    Market Sentiment and Outlook

    The current price represents a 40.2% decline from XRP’s all-time high, potentially offering an attractive entry point for investors looking to accumulate. The convergence of technical indicators suggests a possible trend reversal, though traders should maintain strict risk management given market volatility.

    FAQ

    Q: What are the key support levels for XRP?
    A: The immediate support lies at $1.97, with stronger support at $1.85.

    Q: Could XRP recover to its all-time high?
    A: While possible, it would require a 67% rally from current levels and significant market momentum.

    Q: What factors could trigger a reversal?
    A: Increased institutional adoption, positive regulatory news, and broader crypto market recovery could catalyze upward movement.

  • Ripple RLUSD Integration Hits $250M Market Cap Milestone

    Ripple RLUSD Integration Hits $250M Market Cap Milestone

    Ripple’s enterprise-grade stablecoin RLUSD has achieved a significant milestone, reaching $250 million in market capitalization as it integrates with Ripple Payments, the company’s flagship cross-border settlement platform. This development marks a major step forward in Ripple’s mission to revolutionize institutional payment solutions.

    As covered in our recent analysis XRP Price Prediction: April Target $3.00 as Boredom Phase Ends, Ripple’s ecosystem continues to expand with strategic developments that could drive significant value appreciation.

    RLUSD Integration: A Game-Changer for Cross-Border Payments

    Launched in December 2024, RLUSD has rapidly emerged as a trusted institutional-grade stablecoin, facilitating over $10 billion in trading volume. Unlike retail-focused stablecoins, RLUSD specifically targets enterprise use cases, offering:

    • Instantaneous settlement capabilities
    • Enhanced cost efficiency for cross-border transfers
    • Built-in compliance features
    • Seamless integration with traditional banking infrastructure

    SPONSORED

    Trade with up to 100x leverage on perpetual contracts

    Trade Now on Defx

    Strategic Exchange Partnerships Fuel Growth

    RLUSD’s market presence continues to expand through strategic exchange listings, including:

    • LMAX Digital
    • Zero Hash
    • Bitstamp
    • Bullish
    • Kraken (newest addition)

    Enterprise Adoption and Use Cases

    Initial adoption by BKK Forex and iSend for treasury operations demonstrates RLUSD’s practical utility in real-world financial operations. The stablecoin serves multiple enterprise use cases:

    • Cross-border payment settlement
    • Trading collateral for both crypto and traditional markets
    • Bridge between fiat and crypto ecosystems
    • NGO payment streamlining

    Market Impact and Future Outlook

    At press time, XRP trades at $2.04, with the RLUSD integration potentially catalyzing further growth. Jack McDonald, Senior Vice President of Stablecoins at Ripple, notes that RLUSD’s adoption has exceeded internal projections, suggesting strong market confidence in the solution.

    Frequently Asked Questions

    What makes RLUSD different from other stablecoins?

    RLUSD is specifically designed for enterprise use, featuring built-in compliance tools and focusing on institutional rather than retail applications.

    How does RLUSD integration benefit Ripple Payments users?

    The integration enables faster settlement times, reduced costs, and enhanced compliance features for cross-border transactions.

    What is RLUSD’s current market presence?

    RLUSD has achieved $250 million in market capitalization and facilitated $10 billion in trading volume since its December 2024 launch.

  • XRP Price Tests Critical $1.97 Support as Trump Tariffs Shake Markets

    XRP Price Tests Critical $1.97 Support as Trump Tariffs Shake Markets

    XRP finds itself at a crucial turning point as the digital asset tests the critical $1.97 support level amid growing market uncertainty. Recent price action shows increasing bearish pressure, with market participants closely monitoring this key psychological level.

    Market Dynamics and Liquidity Concerns

    Renowned crypto analyst Grumlin Mystery has highlighted a concerning trend in market liquidity, pointing to potential further downside for XRP. The analysis suggests that recent U.S. trade policy shifts and Trump’s tariff implementations are creating headwinds for crypto assets, particularly affecting trading volumes and price stability.

    SPONSORED

    Trade XRP with up to 100x leverage on perpetual contracts

    Trade Now on Defx

    Technical Analysis and Price Levels

    The current price action presents two potential scenarios:

    • Bullish Case: A successful defense of $1.96 could trigger a rally toward $2.64
    • Bearish Case: A break below support might lead to tests of $1.70 and $1.34

    Impact of Economic Policy

    Similar to Bitcoin’s recent reaction to trade policy news, XRP faces increased pressure from macroeconomic factors. The uncertainty surrounding U.S. economic policy and its impact on crypto markets remains a key concern for traders.

    FAQ Section

    What are the key support levels for XRP?

    The immediate support lies at $1.96, followed by $1.70 and $1.34.

    How do Trump’s tariffs affect XRP price?

    The tariffs impact market liquidity and risk appetite, potentially leading to decreased trading volumes and price pressure.

    What’s the next major resistance level?

    If bulls regain control, the next significant resistance stands at $2.64.

    Time to Read: 4 minutes

  • Ethereum Price Set for Major Rally Against XRP, Analysts Project $4,800 Target

    Ethereum Price Set for Major Rally Against XRP, Analysts Project $4,800 Target

    Ethereum (ETH) appears poised for a significant price surge against XRP, with multiple analysts projecting strong upside potential for the second-largest cryptocurrency. Recent analysis warning of an ETH drop to $1,400 may need revision as new technical indicators emerge showing bullish momentum.

    Key Technical Analysis Points to ETH Dominance

    CredibullCrypto, a respected market analyst, has identified several compelling reasons why Ethereum is likely to outperform XRP in the coming months:

    • The XRP/ETH trading pair shows clear bearish divergence after a 250% rally
    • Strong support established in ETH’s high-timeframe demand zone
    • Technical indicators suggest XRP may retrace to $1.60-$1.80 range
    • ETH positioned for potential breakout above key resistance levels

    SPONSORED

    Trade Ethereum with up to 100x leverage on perpetual contracts

    Trade Now on Defx

    Price Targets and Support Levels

    Multiple analysts have weighed in with specific price predictions for Ethereum:

    • Immediate resistance zone: $3,600-$4,000
    • Potential breakout target: $4,400-$4,800
    • Critical support levels: $1,800 and $1,200
    • XRP/ETH pair expected to find support at 0.00087-0.00088

    Market Implications and Trading Opportunities

    The current market structure presents several key opportunities for traders:

    1. Potential accumulation zone between $1,800-$2,000
    2. Clear resistance levels for setting take-profit targets
    3. Multiple entry points during expected XRP correction
    4. Long-term upside potential remains intact

    Frequently Asked Questions

    Why is Ethereum expected to outperform XRP?

    Technical indicators show XRP is due for a correction after its recent rally, while Ethereum maintains strong support levels and shows signs of accumulation.

    What are the key price levels to watch?

    Traders should monitor the $1,800 support level and $3,600-$4,000 resistance zone for potential breakout opportunities.

    When could the predicted rally begin?

    Analysts suggest the movement could initiate once XRP completes its correction to the $1.60-$1.80 range, potentially within the next few weeks.

  • Dogecoin Supply in Profit Plunges 10%: Major Price Bottom Signal?

    Recent on-chain data reveals a significant shift in Dogecoin’s profitability metrics, with the popular meme coin experiencing one of the sharpest declines in Supply in Profit among major cryptocurrencies. This development could signal a potential price bottom, according to market analysts.

    Understanding the Supply in Profit Decline

    According to data from Glassnode, Dogecoin’s Supply in Profit has decreased by nearly 10% over the past month, bringing the total percentage of profitable DOGE holdings to 53.6%. This dramatic shift comes as Dogecoin recently experienced a 15% price crash, highlighting the volatile nature of cryptocurrency markets.

    XRP Faces Similar Pressure

    Alongside Dogecoin, XRP has witnessed a notable decline in its Supply in Profit metrics, with a 5.2% decrease bringing its total to 81.5%. This trend aligns with broader market observations, though some analysts remain bullish on XRP’s long-term prospects.

    SPONSORED

    Trade meme coins like DOGE with up to 100x leverage and maximize your potential returns

    Trade Now on Defx

    Market Implications and Technical Analysis

    The significant decrease in Supply in Profit often serves as a contrarian indicator, potentially signaling a market bottom. Historical data suggests that when profit-taking pressure subsides, assets typically find stronger support levels for future price appreciation.

    Comparative Market Performance

    While DOGE and XRP struggle, other cryptocurrencies like Toncoin (TON) and BNB have seen substantial increases in their Supply in Profit metrics:

    • TON: +23.8% (Total: 94.1%)
    • BNB: +17.4% (Total: 86.3%)
    • Solana: -4.4% (Total: 35.2%)

    Expert Outlook and Price Predictions

    At press time, DOGE is trading at $0.173, representing an 11% weekly decline. However, the reduced profit-taking pressure could set the stage for a potential recovery, particularly if broader market sentiment improves.

    FAQ Section

    What does Supply in Profit indicate?

    Supply in Profit represents the percentage of circulating tokens currently worth more than when they were last moved, providing insight into potential selling pressure.

    Why is decreasing Supply in Profit significant?

    Lower Supply in Profit often indicates reduced selling pressure as fewer holders are sitting on unrealized gains, potentially setting the stage for a price recovery.

    How does this affect Dogecoin’s price outlook?

    The significant decrease in profit-taking pressure could signal a market bottom, potentially creating favorable conditions for a price rebound in the coming weeks.

  • RLUSD Stablecoin Surges: $100M Minted as Ripple Expands Payments

    RLUSD Stablecoin Surges: $100M Minted as Ripple Expands Payments

    RLUSD Stablecoin Surges: $100M Minted as Ripple Expands Payments

    In a significant development for the stablecoin market, Ripple’s RLUSD has witnessed remarkable growth with over $100 million in new issuance since April 1, marking one of the highest minting periods in recent months. This surge comes as Ripple’s RLUSD stablecoin continues its impressive growth trajectory in the cross-border payments sector.

    Key RLUSD Developments

    • $50 million RLUSD minted on Tuesday
    • Additional $50 million issued on Wednesday
    • Integration with Ripple’s official payments product
    • BKK Forex and iSend already utilizing the stablecoin

    RLUSD Technical Framework

    RLUSD operates on a robust 1:1 reserve system, ensuring each token is fully backed by:

    • U.S. dollar deposits
    • Short-term U.S. Treasuries
    • Cash equivalents

    Enhanced Security Features

    A notable security enhancement implemented in January introduced the “clawback” feature, allowing token recovery in cases of:

    • Fraud detection
    • Illegal activities
    • Mistaken transfers

    SPONSORED

    Trade stablecoins with up to 100x leverage on perpetual contracts

    Trade Now on Defx

    Market Impact and Competition

    The rapid growth of RLUSD presents significant competition to established stablecoins like USDT and USDC. Recent regulatory developments in stablecoin legislation could further influence market dynamics.

    FAQ Section

    What is RLUSD?

    RLUSD is a stablecoin pegged 1:1 to the U.S. dollar, available on both XRP Ledger and Ethereum blockchain.

    How does RLUSD maintain its peg?

    Through a combination of 1:1 reserves and market arbitrage mechanisms that help stabilize the price around $1.

    What makes RLUSD unique?

    Its integration with Ripple’s payment network and enhanced security features, including the clawback mechanism.

  • XRP Price Prediction: April Target $3.00 as Boredom Phase Ends

    Renowned crypto analyst Egrag has released a detailed XRP price prediction for April 2025, suggesting the token could see significant price action after an extended ‘boredom phase.’ The analysis points to potential moves between $1.79 and $3.00, with a possible 70% rally on the horizon.

    Technical Analysis Points to Major XRP Price Movement

    According to Egrag’s monthly timeframe analysis of XRP/USDT, April could mark a turning point for the digital asset. The current price of $2.1465 sits at a crucial juncture, with several technical indicators suggesting increased volatility ahead. Recent technical analysis has identified a bullish reversal pattern that aligns with Egrag’s predictions.

    Key Price Levels to Watch

    • Support Zone: $1.90-$1.79 (potential downside wick)
    • Resistance Zone: $2.80-$3.00 (upper target range)
    • Critical Price Points: $2.00, $2.05, $2.17, $2.44

    SPONSORED

    Trade XRP with up to 100x leverage on perpetual contracts

    Trade Now on Defx

    Understanding the ‘Boredom Phase’

    Egrag emphasizes that the current market conditions represent a ‘boredom phase,’ characterized by:

    • Waning trader interest
    • Range-bound price action
    • Accumulation opportunities
    • Mental fatigue among market participants

    Potential Catalysts for Price Movement

    Several factors could drive XRP’s price action in April:

    • Technical breakout from current consolidation
    • Increased institutional adoption
    • Market sentiment shift
    • Post-SEC case developments

    FAQ Section

    What is the highest price target for XRP in April 2025?

    According to Egrag’s analysis, XRP could reach $3.00 during April, though this may be a brief price wick.

    What is the minimum price support level?

    The analysis indicates strong support between $1.79-$1.90, which could serve as a temporary bottom.

    How long will the ‘boredom phase’ last?

    While no specific timeframe is given, the analyst suggests this phase could end with a significant price movement in April.

    At press time, XRP trades at $2.1465, positioning itself for what could be a decisive month ahead. Traders and investors are advised to maintain strong risk management practices and consider the broader market context when making investment decisions.

  • XRP Price Faces Critical $2.00 Support Test After 10% Weekly Drop

    XRP Price Faces Critical $2.00 Support Test After 10% Weekly Drop

    XRP’s price trajectory has taken a bearish turn, with the digital asset facing significant downward pressure after failing to maintain support above the $2.12 level. Technical analysis reveals mounting concerns as XRP tests critical support zones, potentially signaling more turbulence ahead for Ripple’s native cryptocurrency.

    In a market development that has caught many traders off guard, XRP’s recent attempt to establish support above $2.20 was firmly rejected, leading to a cascade of technical breakdowns that now threaten the psychologically important $2.00 level. This price action comes amid broader market uncertainty, as Bitcoin also faces pressure below the $85,000 mark.

    Technical Breakdown: Understanding XRP’s Current Position

    The technical picture for XRP has deteriorated significantly, with several key developments:

    • Price broke below the critical 100-hourly Simple Moving Average
    • A bearish triangle pattern breakdown occurred at $2.08
    • Weekly low established at $1.9832, threatening further decline
    • RSI readings below 50, indicating bearish momentum

    SPONSORED

    Trade XRP with up to 100x leverage and maximize your profit potential

    Trade Now on Defx

    Key Support and Resistance Levels

    Traders should monitor these critical price levels:

    Support Levels Resistance Levels
    $2.020 $2.10
    $2.00 $2.1750
    $1.980 $2.2350

    Market Implications and Future Outlook

    The current price action suggests XRP could face additional selling pressure if the $2.00 support fails to hold. Traders should watch for potential bounce attempts near this level, as a decisive break below could trigger an extended decline toward $1.95.

    Frequently Asked Questions

    What’s causing XRP’s current price decline?

    Technical factors including the breakdown of support levels and bearish momentum indicators are primary contributors to the current decline.

    Could XRP recover from these levels?

    Recovery is possible if buyers defend the $2.00 support level and push the price above $2.10, which could trigger a relief rally.

    What are the key levels to watch?

    The critical support zone lies between $1.98-$2.00, while significant resistance exists at $2.10 and $2.1750.

    Investors should maintain careful position sizing and implement proper risk management strategies given the current market volatility.