XRP Price Alert: Head and Shoulders Pattern Signals $1.15 Target
XRP faces potential correction to $1.15 as Head and Shoulders pattern emerges on charts, though analyst maintains bullish long-term outlook despite technical…
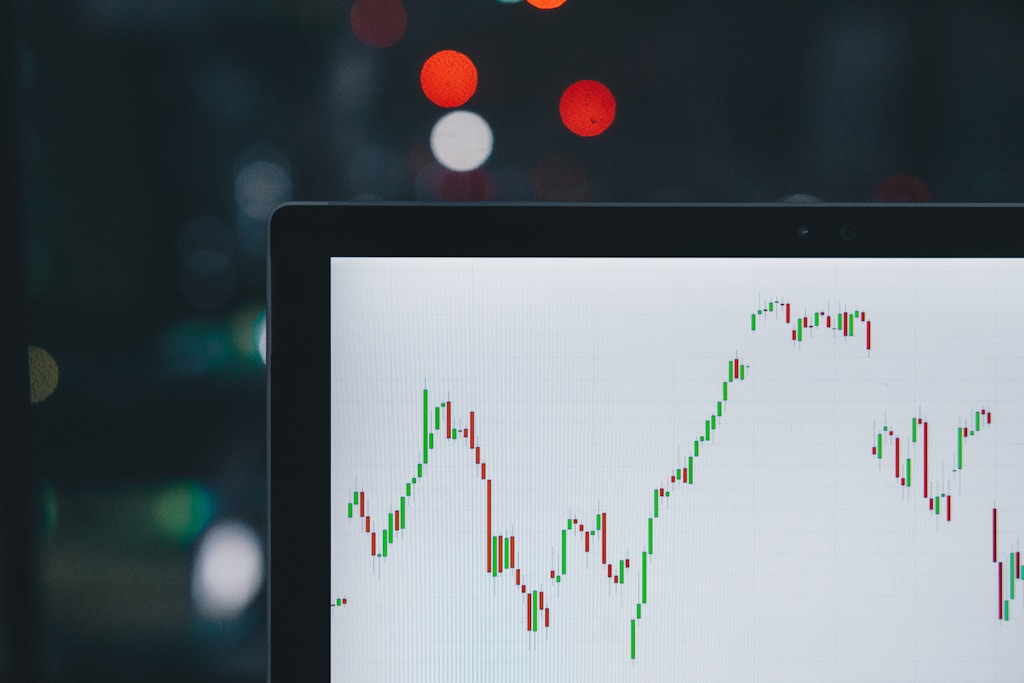
XRP’s price action has triggered a significant technical warning as a potential Head and Shoulders pattern emerges on the charts. Leading crypto analyst ‘The Charting Guy’ has identified this bearish formation, suggesting XRP could see a dramatic pullback to $1.15 in a worst-case scenario. This analysis comes as XRP’s broader market structure remains bullish despite short-term bearish signals.
Technical Analysis Reveals Critical Support Levels
The emerging Head and Shoulders pattern shows several unique characteristics:
- Current price holding above $2 support level
- Unusual formation with two right shoulders
- Key resistance at $2.27
- Upper resistance zone between $3.14 – $3.32
Golden Pocket Retracement Zone
The analyst’s worst-case scenario points to the Fibonacci Golden Pocket retracement zone between $1.15 and $1.30. This technical indicator has historically provided strong support for XRP during major corrections. Additional support levels include:
- Short-term support: $2.00
- Mid-range support: $1.70 – $1.90
- Critical support: $1.15 – $1.30
- Last-line defense: $0.91
Bullish Case Remains Intact
Despite the bearish pattern, several factors support a continued uptrend:
- Strong daily closes above $2
- Higher highs and higher lows maintained
- Potential for healthy retracement rather than trend reversal
- Broader market structure remains bullish
FAQ Section
What is a Head and Shoulders pattern?
A Head and Shoulders pattern is a technical chart formation consisting of three peaks, with the middle peak (head) being higher than the two outer peaks (shoulders). It typically signals a potential trend reversal from bullish to bearish.
What makes this XRP pattern unusual?
This particular formation features two right shoulders instead of the traditional single right shoulder, making it an irregular pattern that may not play out as expected.
What is the Golden Pocket retracement zone?
The Golden Pocket refers to the 61.8% – 78.6% Fibonacci retracement levels, which often act as strong support zones during price corrections in trending markets.


