XRP Price Coils Under $2.20: Key Breakout Pattern Forms
XRP forms tight consolidation pattern below $2.20 with increasing breakout potential. Analysis shows key support at $2.10 as bulls eye crucial resistance level.
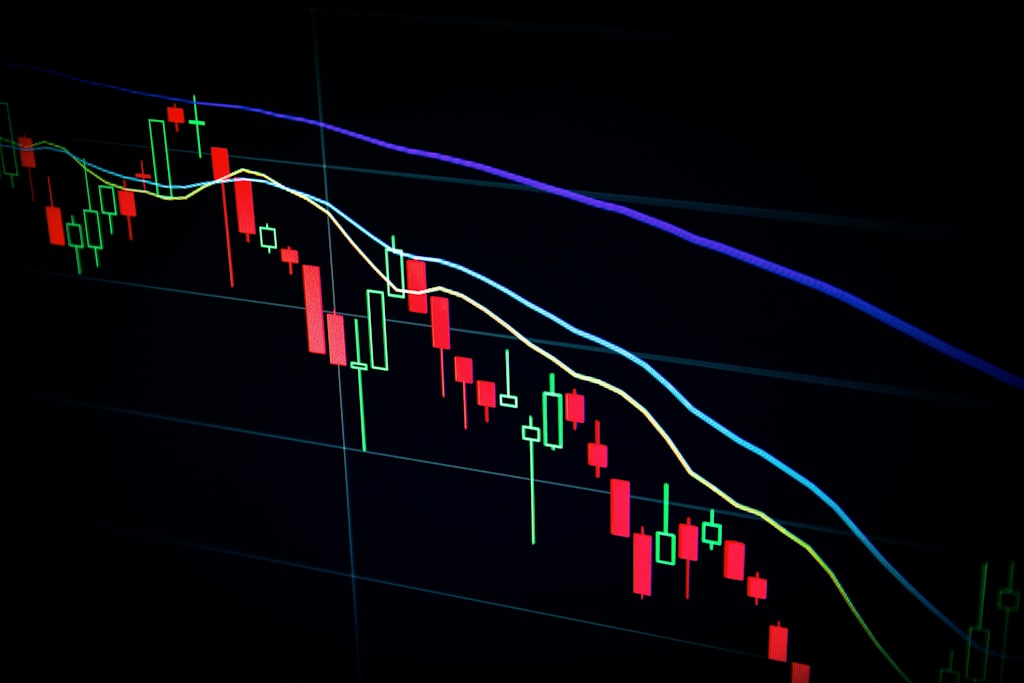
XRP continues to show resilience as it consolidates below the critical $2.20 level, with technical indicators suggesting a potential breakout could be imminent. The sixth-largest cryptocurrency by market capitalization is currently trading at $2.14, maintaining a strong position above key support levels while forming a compelling coiling pattern.
Market Metrics and Technical Setup
Current key metrics for XRP include:
- Price: $2.14
- Market Cap: $124 billion
- 24h Trading Volume: $2.47 billion
- Daily Range: $2.103 – $2.185
This price action follows the pattern identified in recent analysis targeting $2.50, with the current consolidation phase potentially setting up for the next leg higher.
Technical Analysis and Price Patterns
The one-hour chart reveals a tight trading range between $2.13 and $2.18, forming a classic compression pattern. This type of price action typically precedes significant moves, with key levels to watch:
- Immediate Resistance: $2.20
- Key Support: $2.10
- Secondary Support: $2.03
Market Sentiment and Volume Analysis
The current trading volume of $2.47 billion indicates healthy market participation, though slightly below recent averages. This consolidation phase aligns with broader market patterns, as open interest data shows increasing bullish sentiment.
FAQ Section
What is causing XRP’s current price consolidation?
The consolidation appears to be driven by a balance between buying and selling pressure as traders await a clear breakout signal above $2.20.
What are the key levels to watch for XRP?
The primary resistance level is $2.20, while strong support exists at $2.10. A break above $2.20 could trigger a move toward $2.50.
When might XRP break out of its current range?
While exact timing is impossible to predict, the coiling pattern typically resolves within 24-48 hours of formation.


