XRP Price Faces Critical $2.42 Resistance After 7% Drop – Bears Take Control?
XRP price drops 7% from $2.50 resistance as bears take control. Critical technical analysis reveals key support at $2.32 and potential further downside. Lear…

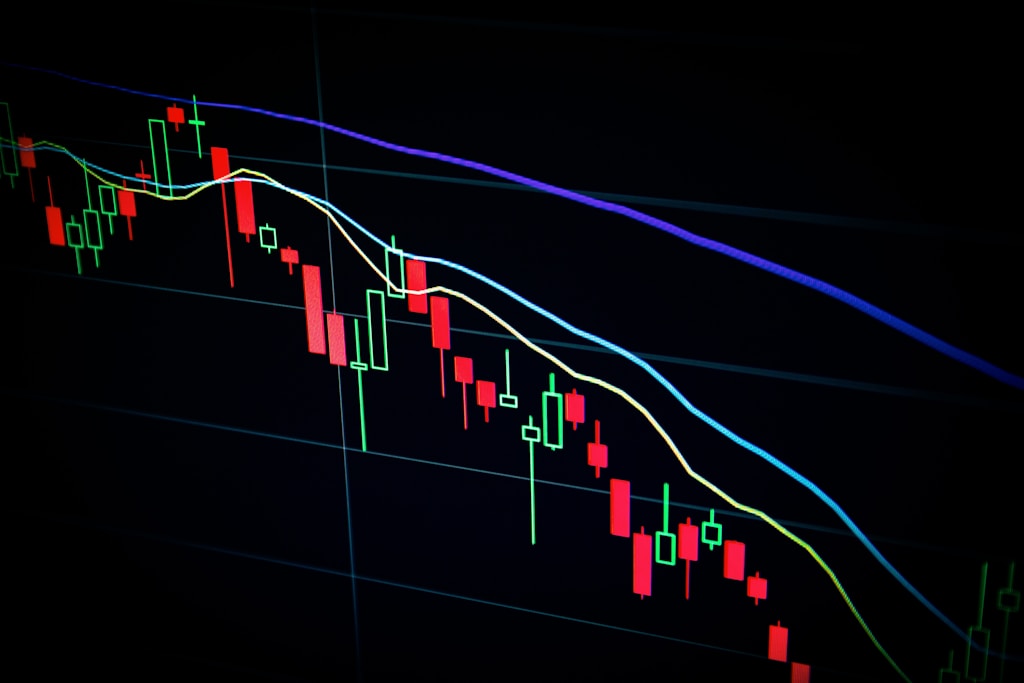
XRP’s price action has taken a bearish turn, dropping 7% from the key $2.50 resistance level as technical indicators point to potential further downside. This analysis explores the critical support and resistance levels that traders should watch, along with expert insights on XRP’s next likely moves.
This price movement comes amid broader market uncertainty, with veteran trader Peter Brandt recently warning of a potential 44% drop to $1.07 for XRP. The current technical setup appears to validate some of these concerns.
Key Technical Levels Show Bearish Pressure
The latest price action reveals several critical technical developments:
- Break below the bullish trend line at $2.440
- Price trading under the 100-hourly Simple Moving Average
- RSI dropping below the crucial 50 level
- MACD showing increasing bearish momentum
Critical Support and Resistance Levels
Traders should monitor these key price levels:
| Type | Level | Significance |
|---|---|---|
| Major Resistance | $2.450 | Previous support turned resistance |
| Immediate Resistance | $2.420 | Current price ceiling |
| Key Support | $2.350 | Critical holding level |
| Major Support | $2.320 | Break below could trigger further selling |
Potential Scenarios and Trading Implications
Two primary scenarios are emerging:
Bullish Case
- Break above $2.450 could target $2.50
- Further momentum could push price to $2.620
- Ultimate target at $2.80 if bulls maintain control
Bearish Case
- Failure to clear $2.420 resistance likely triggers more selling
- Break below $2.320 opens path to $2.20
- Worst case scenario targets $2.150 support zone
Technical Indicator Analysis
Current technical readings suggest increasing bearish pressure:
- MACD: Losing momentum in bearish territory
- RSI: Below 50, indicating bearish control
- Moving Averages: Price below 100-hour SMA
FAQ
What’s causing XRP’s current price decline?
The decline appears technical in nature, triggered by failure to break the $2.50 resistance and broader market uncertainty.
Where is the safest support level for XRP?
The $2.320 level represents the strongest support, with multiple technical indicators confirming its significance.
What could trigger an XRP recovery?
A clear break above $2.450 with strong volume could signal a trend reversal and potential recovery.
Traders should maintain strict risk management given the current market conditions and watch for potential trend confirmation before taking significant positions.


