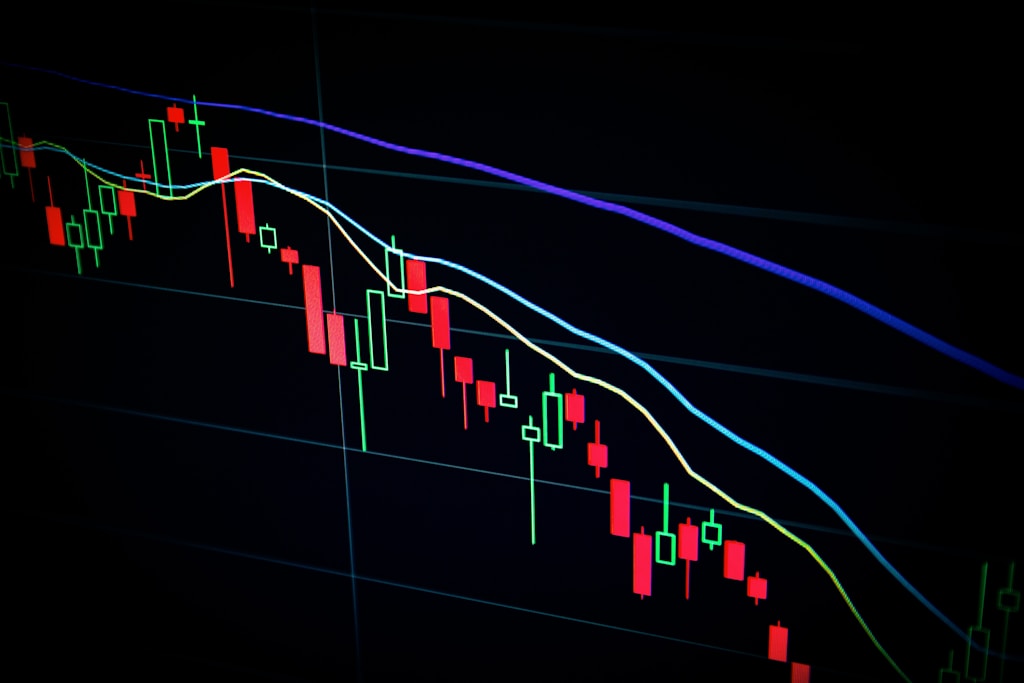
Bitcoin Mining ETF Crashes 43%: CoinShares’ WGMI Fund Leads 2025 Losses
CoinShares’ Valkyrie Bitcoin Mining ETF (WGMI) has emerged as 2025’s worst-performing exchange-traded fund, plummeting 43% year-to-date amid mounting challenges in the bitcoin mining sector. This dramatic decline comes as mining efficiency continues to evolve, creating a complex landscape for investors.
WGMI ETF Holdings Face Severe Downturn
The fund’s major holdings have experienced significant losses:
- IREN (15% weighting): -42%
- Core Scientific (14% weighting): -48%
- Cipher Mining (9.6% weighting): -52%
- NVIDIA (5% weighting): -20%
SPONSORED
Trade Bitcoin mining stocks with up to 100x leverage on perpetual contracts
Understanding WGMI’s Investment Strategy
The ETF focuses on companies generating at least 50% of their revenue from bitcoin mining operations or related services. Currently managing $147.2 million across 21 holdings, WGMI’s performance contrasts sharply with traditional mining sectors, particularly gold mining ETFs, which have seen gains of up to 38% this year.
Key Challenges Facing Bitcoin Miners
Several factors have contributed to the mining sector’s struggles:
- Record-high network hash rate (832 EH/s)
- Increased mining difficulty
- Low transaction fees
- Reduced profitability margins
FAQ Section
Why is the WGMI ETF performing poorly?
The fund’s poor performance stems from increasing mining difficulty, low transaction fees, and operational challenges facing bitcoin mining companies.
How does WGMI compare to other mining ETFs?
While WGMI has declined 43%, traditional mining ETFs, particularly in the gold sector, have seen positive returns of up to 38%.
What are the implications for bitcoin mining investors?
Investors should carefully consider the increasing operational challenges and rising costs in the bitcoin mining sector before making investment decisions.
As the bitcoin mining landscape continues to evolve, investors must carefully weigh the risks and opportunities in this volatile sector. The WGMI ETF’s performance serves as a stark reminder of the challenges facing mining operations in 2025.